DOT/USD is in a triangular consolidation. The bias remains bearish.

DOT/USD is in a triangular consolidation
The bias remains bearish
Conservative traders might want to wait for the market to move first
There is nothing positive in the DOT/USD chart for bulls. The price action remains constrained by a triangular pattern that formed in the last twelve months.
Sure enough, the triangle may break in either direction. But the bias is bearish while Polkadot’s price action holds inside the pattern.
Polkadot’s price collapsed after the triple failure at the $50 area. The dollar’s strength was one reason, but surely some other factors contributed to the selloff.

Not even the renewed optimism in the cryptocurrency market that was seen in 2023 was enough. After a small bounce, Polkadot gave away all of its 2023 gains as the market was (and still is) unable to break the lower highs series. At the same time, it pushes for another lower low – a bearish development.
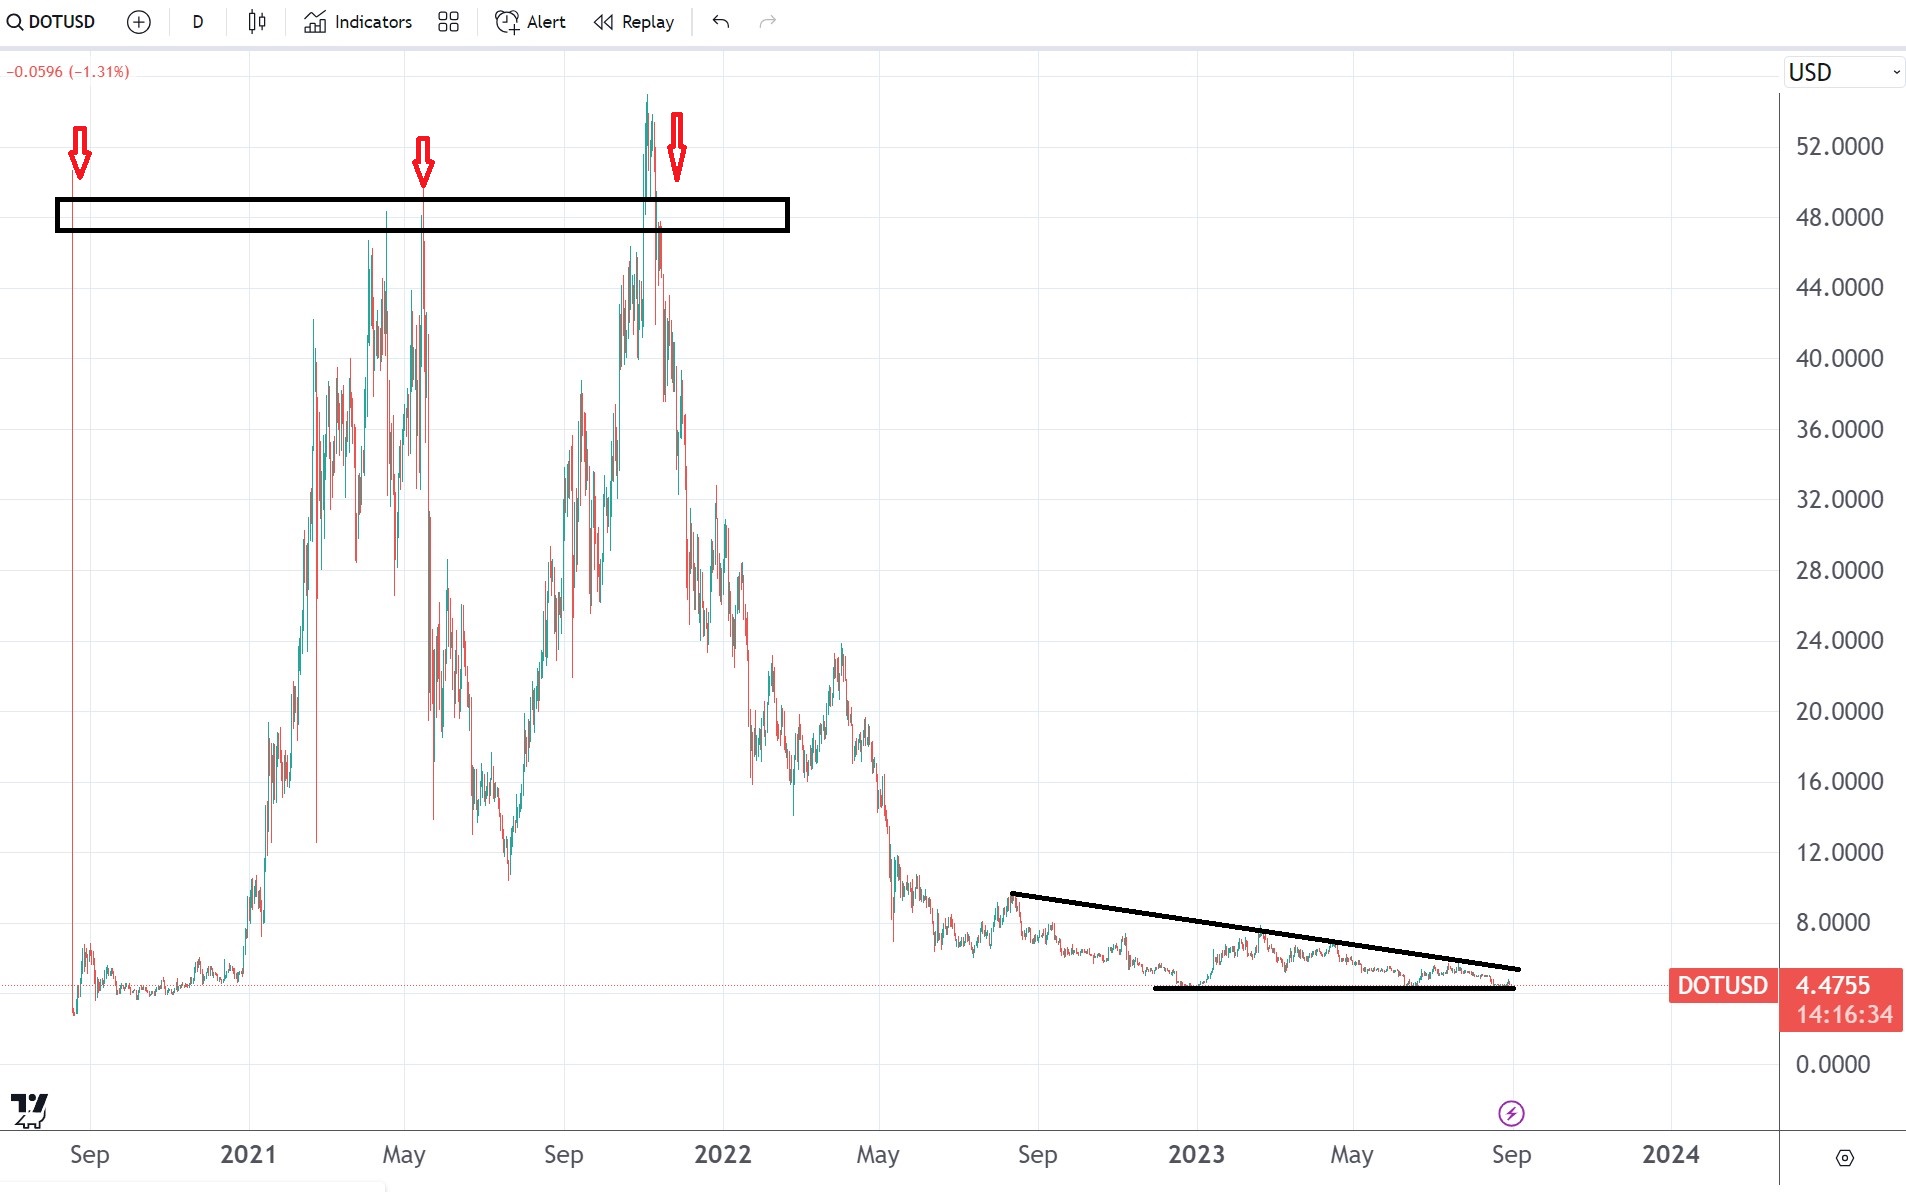
Polkadot chart by TradingView
The bullish case for Polkadot
The only way to construct a bullish case for Polkadot is to wait for the market to move first simply. For a “proof of life,” if you want.
Such proof that the market turned bullish will appear only if the price moves above $8. And, if it holds there.
It would mean that the previous lower high is broken, and the bias turned bullish. Until such a move is seen on the daily chart, buying DOT/USD is risky.
The bearish case for Polkadot
It is easier to build a bearish case because of the descending triangle mentioned earlier. If the market makes a new lower low, the triangle’s measured move points to a drop toward the $1 area.