
After a 30% Price Drop, Is Cardano Poised for Further Declines?

The Cardano (ADA) price is in the midst of a strong correction. However, it is now encountering significant support, from which the price could bounce.
Will the Cardano price see an upswing again soon? Or will the price fall even further?
Cardano’s Downturn: A 31% Price Drop Over the Last Month
Last month, Cardano faced a significant obstacle in surpassing the golden ratio resistance at approximately $0.86. Subsequently, the cryptocurrency entered a corrective phase, which appears to persist into the current month.
As a result, the price has experienced a decline of 31% overall. This downward trend is reflected in the monthly chart, with the Moving Average Convergence Divergence (MACD) histogram showing a bearish inclination.

Despite this, the MACD lines maintain a bullish crossover, and the Relative Strength Index (RSI) remains in neutral territory. In the event of a substantial correction, Cardano can expect notable support around $0.46, where the 50-month Exponential Moving Average (EMA) plays a crucial role.
Read More: How To Buy Cardano (ADA) and Everything You Need To Know
Continuation of Correction for Cardano Price?
A conceivable scenario for the ADA price entails a bullish rebound from the current Fib support level at approximately $0.584. Cardano could ascend toward the golden ratio at around $0.72 if this materializes.
The corrective trajectory would be nullified only upon breaching the golden ratio at approximately $0.72, paving the way for Cardano to target the golden ratio at around $0.86.
However, the ADA price might retreat to the golden ratio support at approximately $0.44 if a bearish rejection. Notably, the MACD lines in the weekly chart have recently crossed into bearish territory.
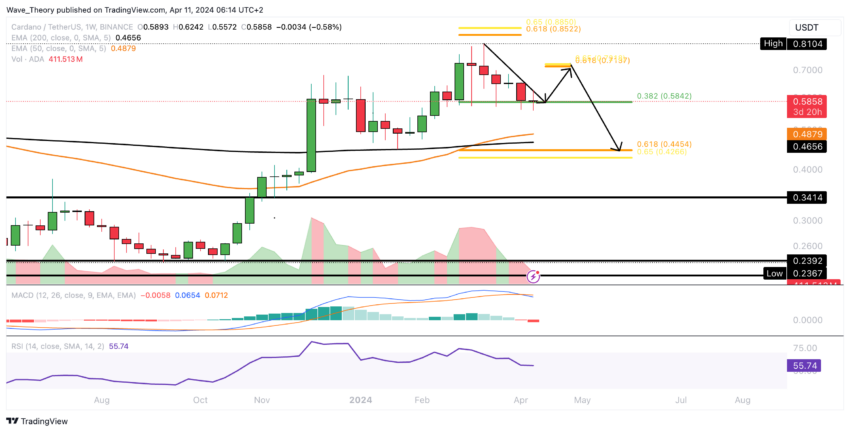
Moreover, the MACD histogram exhibits a downward trend and the RSI hovers in neutral territory. Conversely, the EMAs continue to display a golden crossover, affirming the bullish trend in the medium term.
Short-Term Upward Shift for Cardano Price?
If Cardano manages to initiate a bullish rebound from the 0.382 Fib support level at approximately $0.584, it could potentially surge by approximately 22% to confront the golden ratio resistance at around $0.72.
However, the presence of the 50-day EMA as resistance at roughly $0.624 cannot be overlooked. Notwithstanding, the indicators currently convey predominantly bullish signals.
The daily chart still portrays a golden crossover, while the MACD histogram has displayed bullish momentum over the past few days. Consequently, there is a possibility that the MACD lines might soon cross bullishly.
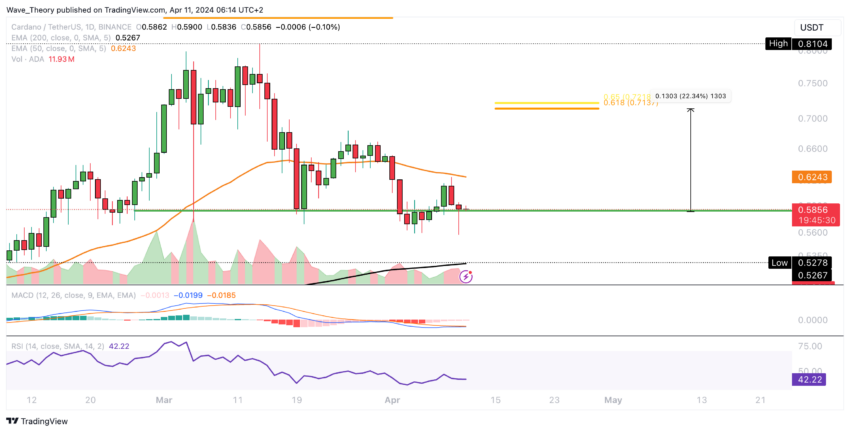
Furthermore, the RSI is in neutral territory, indicating a slight bullish divergence.
Bearish Signal: Death Cross Emerges on Cardano’s 4-Hour Chart
In the 4-hour chart, the emergence of a death cross among the EMAs solidifies the trend as bearish in the short term. Additionally, the bearish crossover of the MACD lines further corroborates this sentiment.
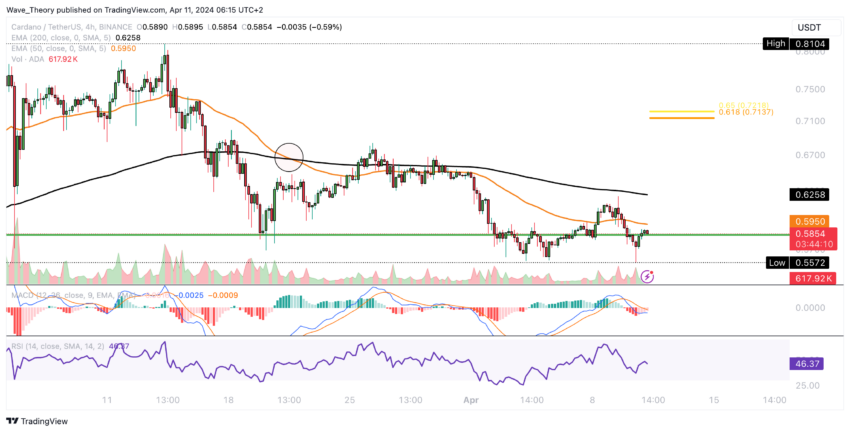
Although a slight bullish divergence is visible in the RSI, it remains in neutral territory.
Read More: Cardano (ADA) Price Prediction 2024/2025/2030
Cardano vs. Bitcoin: ADA Breaks Crucial Golden Ratio at 0.00011 BTC
Against Bitcoin, Cardano is currently encountering horizontal support levels ranging from approximately 0.0000083 BTC to 0.0000097 BTC. However, the MACD histogram has displayed a bearish trend since last month, hinting at a potential bearish crossover of the MACD lines.
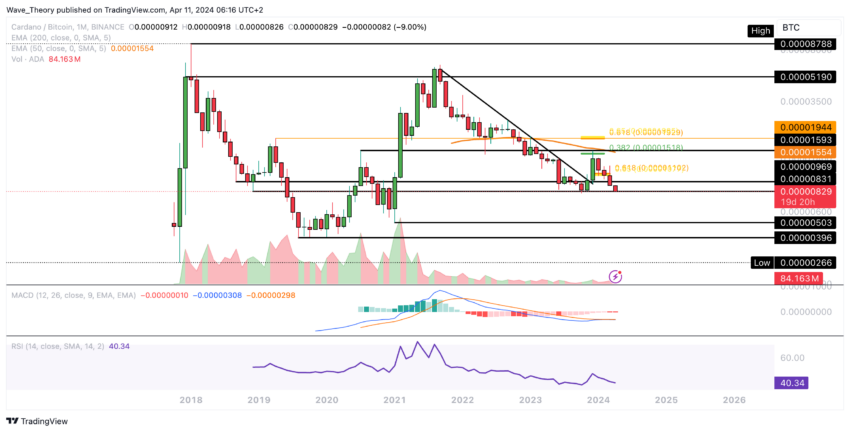
Despite the neutral stance of the RSI, there remains a possibility for Cardano to rebound bullishly from this support level. Alternatively, should the support fail, the next significant level of support is expected to be found between approximately 0.000004 BTC and 0.000005 BTC.
Disclaimer
In line with the Trust Project guidelines, this price analysis article is for informational purposes only and should not be considered financial or investment advice. BeInCrypto is committed to accurate, unbiased reporting, but market conditions are subject to change without notice. Always conduct your own research and consult with a professional before making any financial decisions. Please note that our Terms and Conditions, Privacy Policy, and Disclaimers have been updated.