
Bitcoin (BTC) Price Bounces After Bearish Start to 2024

The Bitcoin (BTC) price has decreased in 2024 but regained its footing with a strong bounce last week.
BTC trades very close to a confluence of Fib and horizontal resistance levels. Will it break out or get rejected?
Bitcoin Regains Footing
The technical analysis of the weekly time frame shows that the Bitcoin price was rejected by the 0.618 Fib retracement resistance level in the second week of January 2024.
This created a bearish weekly shooting star candlestick (red icon), characterized by a very long upper wick. After the rejection, BTC decreased below the 0.5 Fib retracement support level. However, it began an upward movement last week and has nearly reclaimed it.

Despite this bounce, the weekly Relative Strength Index (RSI) is still bearish. Market traders use the RSI as a momentum indicator to identify overbought or oversold conditions and to decide whether to accumulate or sell an asset.
Readings above 50 and an upward trend indicate that bulls still have an advantage, whereas readings below 50 suggest the opposite. The RSI is decreasing and fell below 70 after previously moving into overbought territory, both signs of a bearish trend.
Read More: Where To Trade Bitcoin Futures
What do Analysts Say?
Cryptocurrency traders and analysts on X have a mixed view of the future BTC trend.
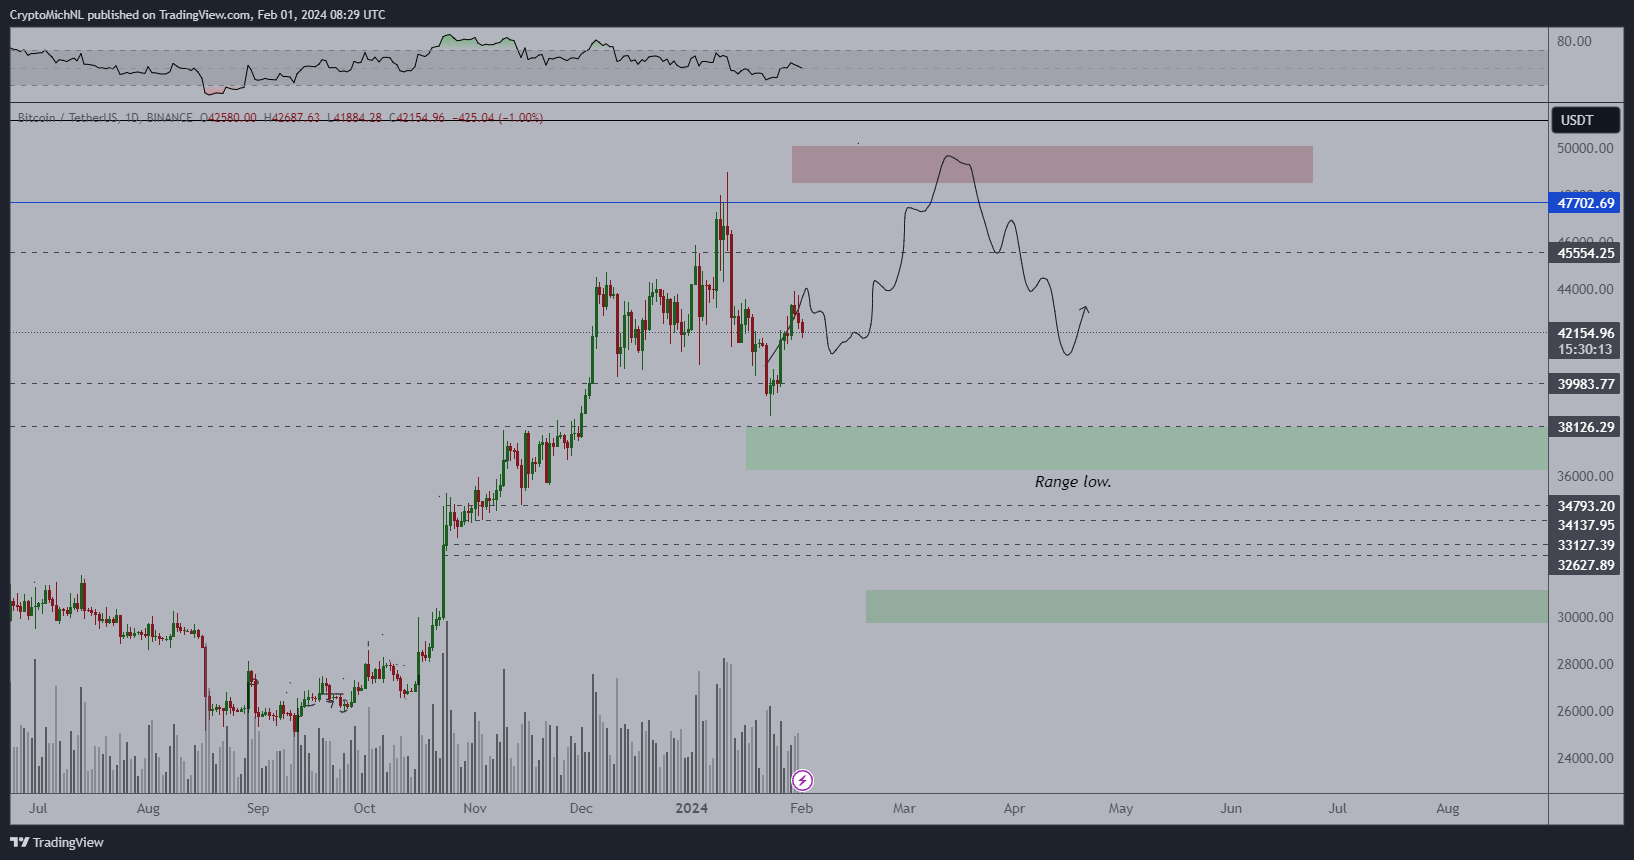
CryptoMichNL suggests the price will increase to $50,000. He tweeted:
#Bitcoin consolidating and acting in a boring manner. Probably it will look for a higher low after which we’re having a slight pre-halving push to $48-51K.
XForceGlobal has the same outlook, though he uses Elliott Wave theory to come to his conclusion. Credible Crypto suggests the price has begun a new trend that will take it to new highs. However, he believes that a short-term retracement is due.
Read More: Who Owns the Most Bitcoin in 2024?
BTC Price Prediction: Will New Lows Emerge?
The technical analysis of the daily time frame gives a mixed reading because of the price action and RSI readings.
The bullish outlook shows that the BTC price reclaimed the $41,000 horizontal support area after deviating below it. However, it trades below the 0.5 Fib retracement resistance level at $43,800.
Furthermore, a strong resistance level at $45,100 is created by the 0.618 Fib retracement resistance level and a horizontal resistance area.
Finally, the daily RSI still faces resistance from its bearish divergence trend line (green) and is close to 50. It must break out of this resistance to begin a bullish trend reversal.
If BTC breaks out above the $43,800 resistance, it can increase by 5% to the $45,100 resistance.
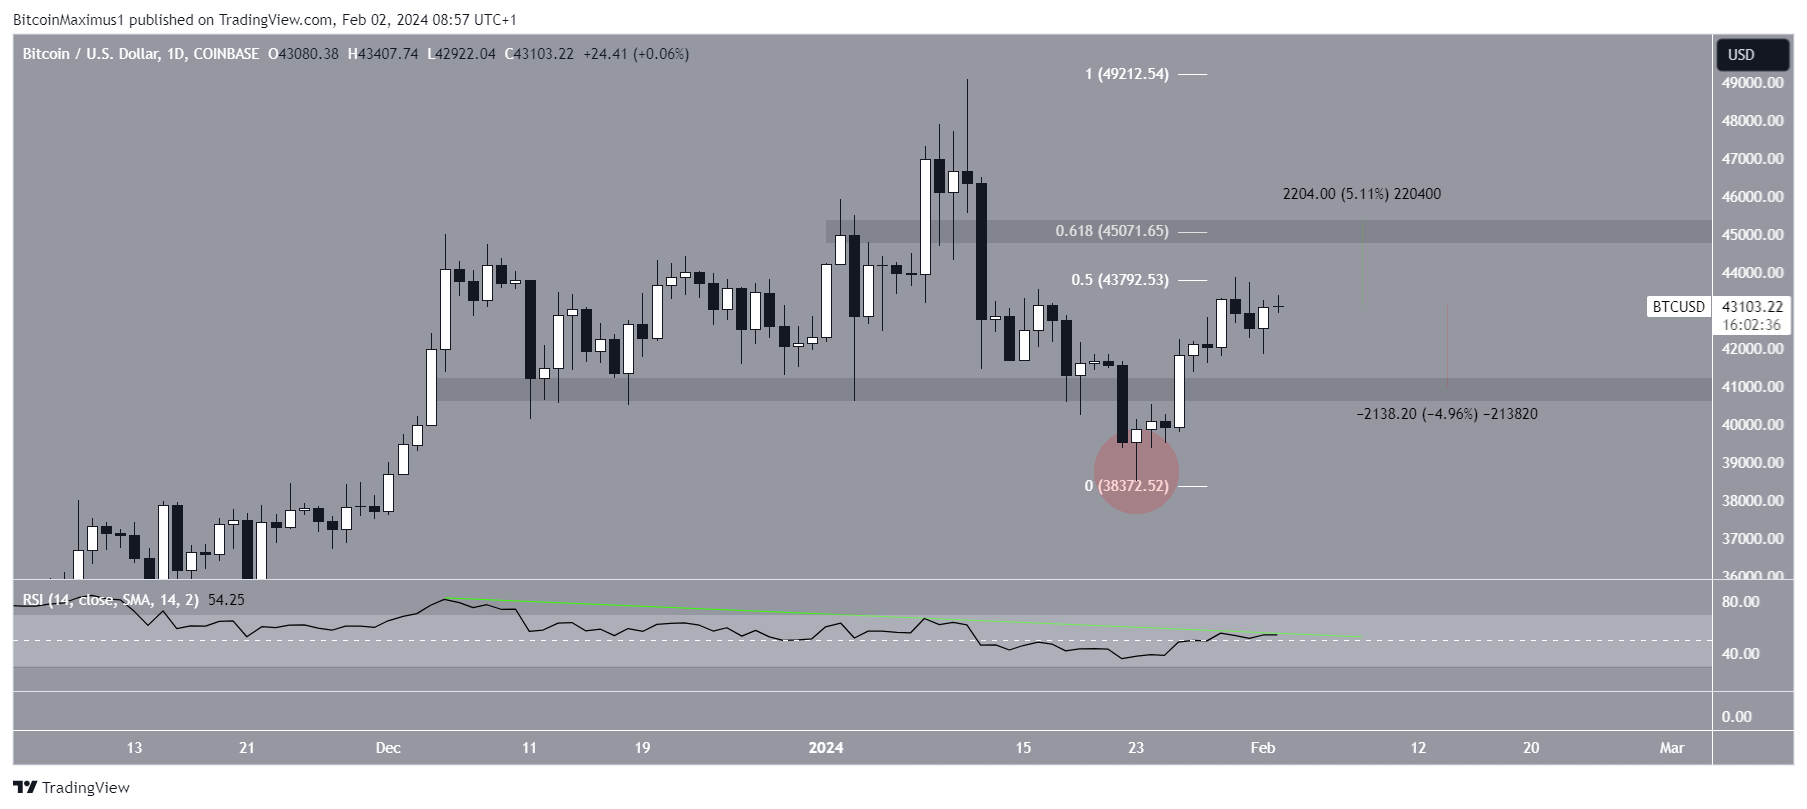
Despite the bullish BTC price prediction, a rejection from the 0.5 Fib retracement resistance level can trigger a 5% drop to $41,000.
For BeInCrypto‘s latest crypto market analysis, click here.
Read More: What is a Bitcoin ETF?
Disclaimer
In line with the Trust Project guidelines, this price analysis article is for informational purposes only and should not be considered financial or investment advice. BeInCrypto is committed to accurate, unbiased reporting, but market conditions are subject to change without notice. Always conduct your own research and consult with a professional before making any financial decisions. Please note that our Terms and Conditions, Privacy Policy, and Disclaimers have been updated.