
Bitcoin (BTC) Price Creates Six Bullish Candlesticks in a Row

The Bitcoin (BTC) price has created six bullish weekly candlesticks since the upward movement began in October.
The BTC price has traded inside a symmetrical triangle pattern since November. Will it break out, or will the upward trend falter?
Bitcoin Reaches New Yearly High
The technical analysis from the weekly time frame shows that the BTC price has increased swiftly since the start of October. During this time, the price broke out from a descending resistance trend line that had been in place for 530 days.
BTC reached a new yearly high of $38,437 on November 24 before falling slightly.

An interesting development about the upward movement is that BTC created six successive bullish weekly candlesticks.
The last time this happened was in October 2020 (highlighted), when the previous bullish cycle was beginning.
Market traders use the Relative Strength Index (RSI) as a momentum indicator to identify overbought or oversold conditions and to decide whether to accumulate or sell an asset.
Readings above 50 and an upward trend indicate that bulls still have an advantage, whereas readings below 50 suggest the opposite.
The RSI is increasing but is in overbought territory (green icon). Interestingly, the previous time the RSI was at this level (black icon) was in October 2020.
Read More: 9 Best AI Crypto Trading Bots to Maximize Your Profits
What Do Analysts Say?
Cryptocurrency traders and analysts on X believe the BTC price rate of increase will pick up soon.
JJCycles is bullish for fundamental and technical reasons. He stated that:
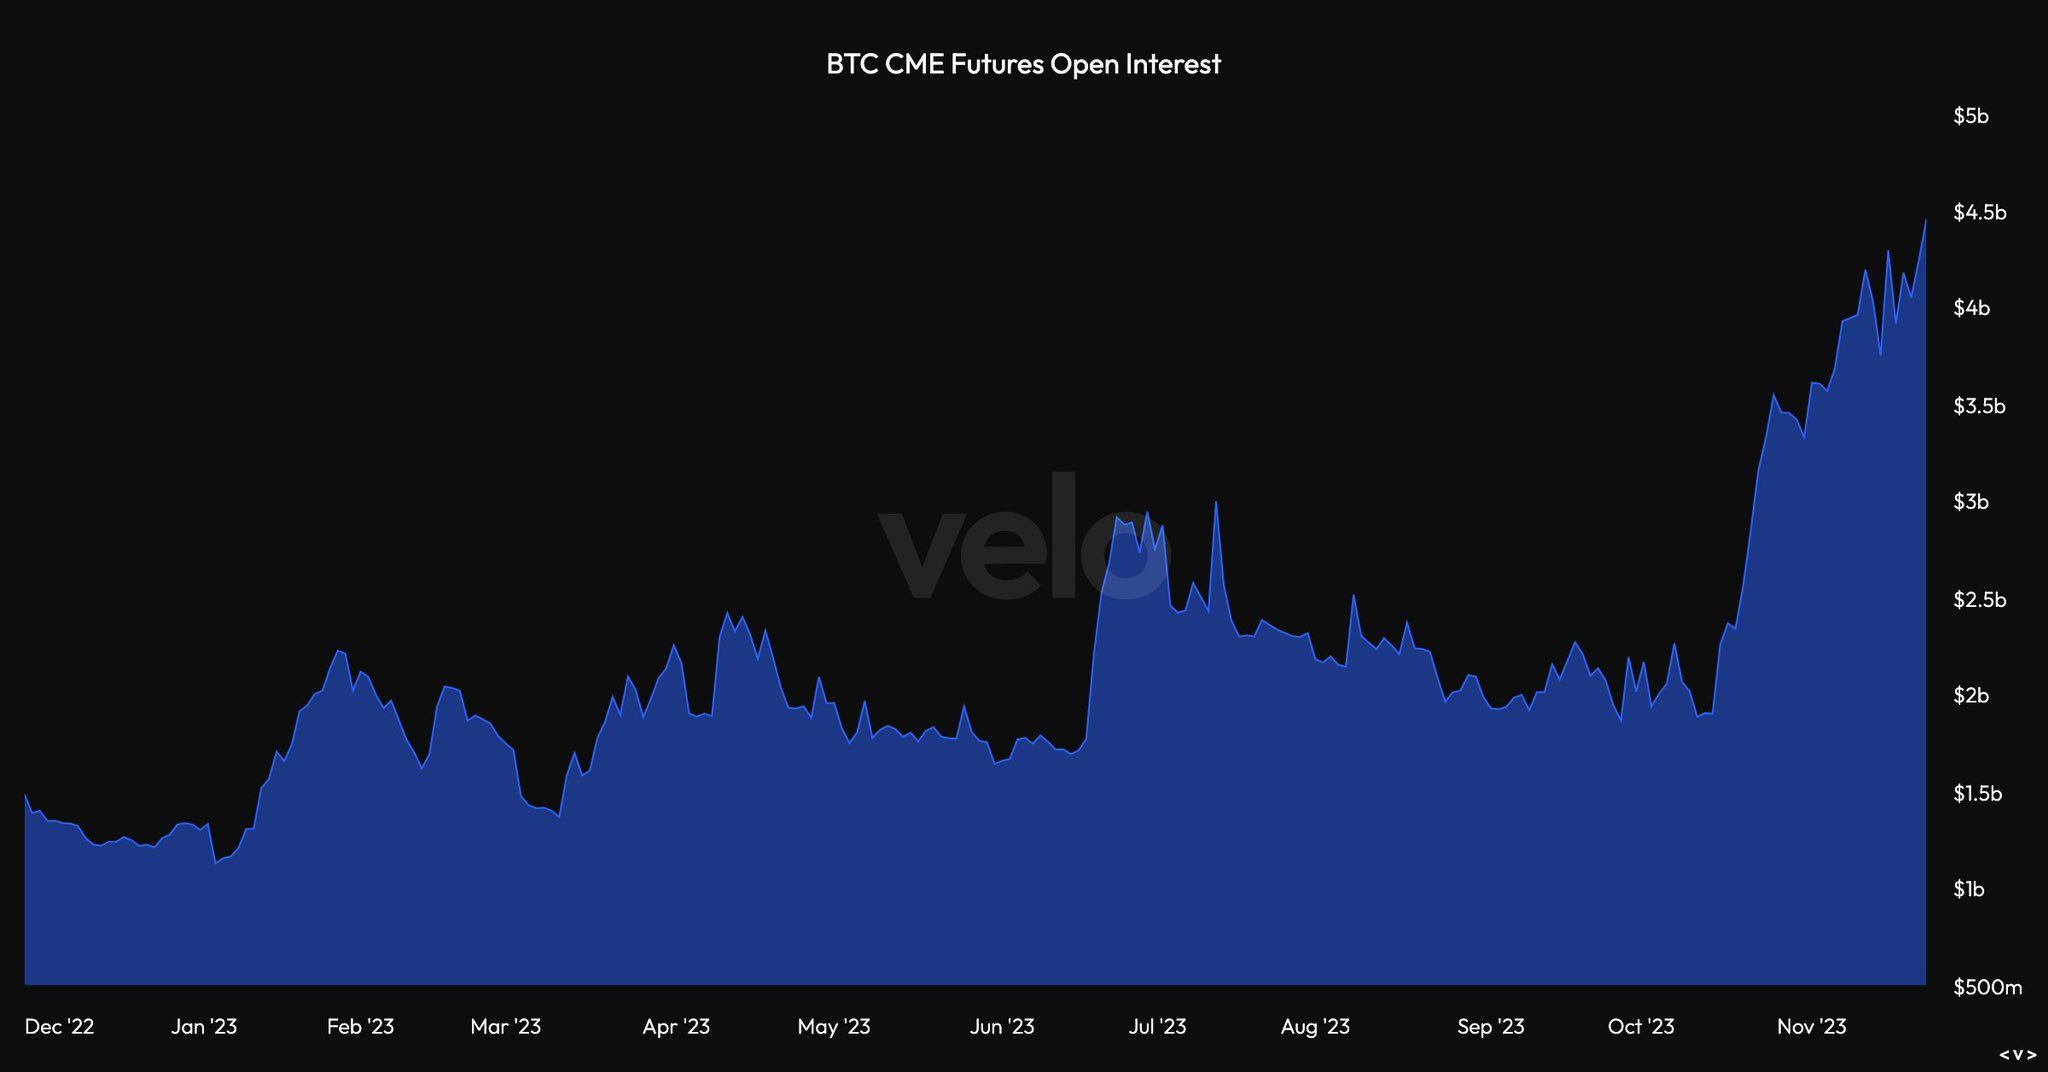
What if CME (US institutions) opened longs to hedge for the spot #Bitcoin ETF approval which might be imminent? Open interest surely surged on CME in the last couple of weeks.
Currently, open interest in CME is nearly $4.5 billion.
He also believes that the ongoing vertical accumulation will resolve to the upside. Bob Loukas has the exact same thoughts, suggesting that an explosive movement will take the price out of the 30+ day upward-sloping trend.
Unlike the other two traders, CredibleCrypto suggests that an initial drop is expected before BTC eventually resumes its previous ascent.
Read More: Best Upcoming Airdrops in 2023
BTC Price Prediction: Will Price Finally Reach $40,000?
Elliott Wave (EW) theory involves the analysis of recurring long-term price patterns and investor psychology to determine the direction of a trend.
The most likely count suggests that BTC is in wave three of a five-wave increase (white), which began in September. Wave three has extended.
The sub-wave count is in black, indicating that BTC is in sub-wave four. The corrective sub-wave is triangle-shaped, the most common pattern for this wave.
If BTC breaks out from this triangle, it can increase by 10% to the next resistance at $41,000. The target is found by projecting the triangle’s height to the breakout point.
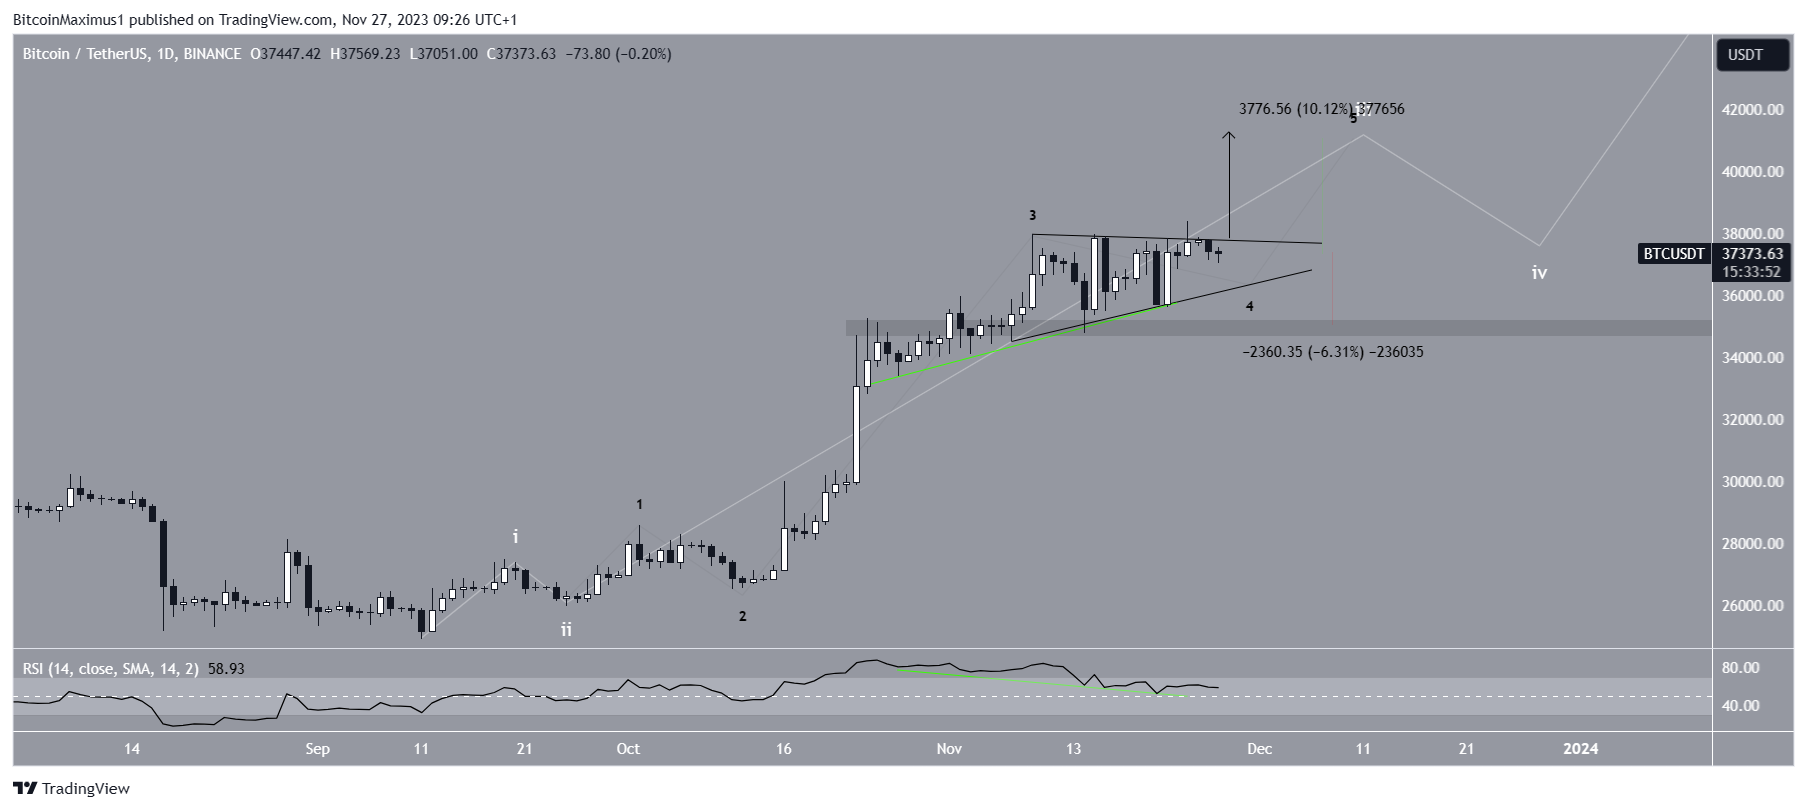
Despite this bullish BTC price prediction, a breakdown from the triangle can lead to a 6% drop to the closest support at $35,000.
For BeInCrypto’s latest crypto market analysis, click here.
Disclaimer
In line with the Trust Project guidelines, this price analysis article is for informational purposes only and should not be considered financial or investment advice. BeInCrypto is committed to accurate, unbiased reporting, but market conditions are subject to change without notice. Always conduct your own research and consult with a professional before making any financial decisions.