
Bitcoin (BTC) Price Reaches Yearly High

The Bitcoin (BTC) price reached a new yearly high of $44,490 on December 5.
The high was made above a critical long-term resistance area, but the BTC price still has yet to reach a close above it.
Bitcoin Reaches Long-Term Resistance
The weekly time frame chart shows that the Bitcoin price has increased swiftly since the middle of October, creating several bullish weekly candlesticks.
This week, the Bitcoin price reached a new yearly high of $44,490. The high was made inside a critical horizontal and Fib resistance area.
Market traders often use the RSI as a momentum indicator to identify overbought or oversold conditions and to decide whether to accumulate or sell an asset.
Readings above 50 and an upward trend indicate that bulls still have an advantage, whereas readings below 50 suggest the opposite.
The weekly RSI is increasing and is above 50, both positive signs. The current reading of 80 was last seen in November 2020 (green), preceding the increase to the current BTC all-time high.
Read More:9 Best AI Crypto Trading Bots to Maximize Your Profits
What Do Traders Say?
Cryptocurrency traders and analysts on X do not agree about the future BTC trend.
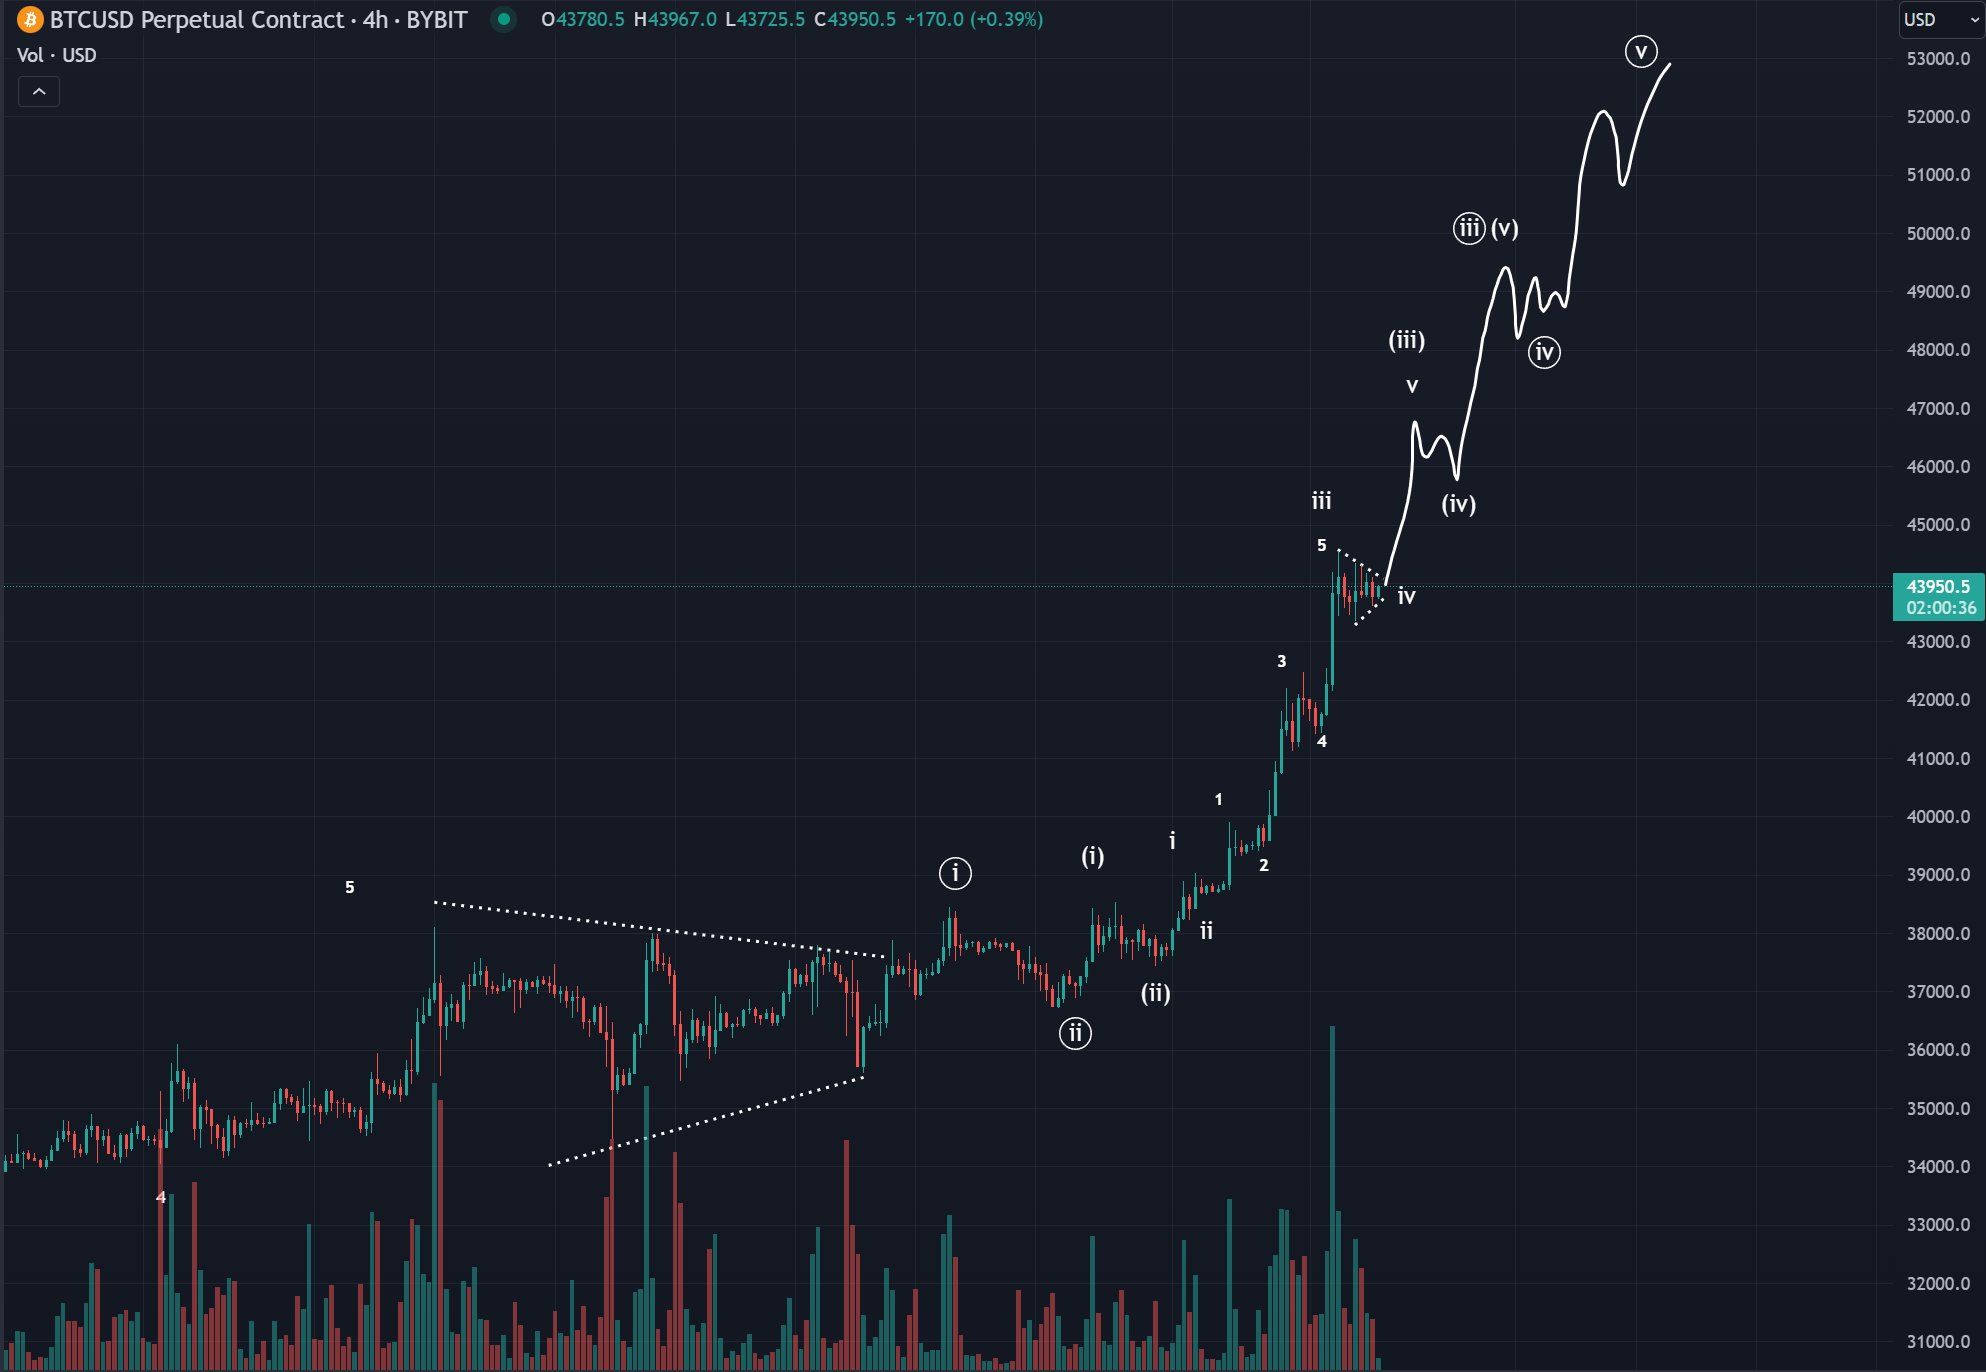
Bluntz Capital is bullish because of its Elliott Wave count. Technical analysts employ the Elliott Wave (EW) theory to identify recurring long-term price patterns and investor psychology, which helps them determine the direction of a trend.
Bluntz stated that:
“All i see is people taking profit and warning of impending 10-15% pullbacks. ya’ll not ready for how far this leg from 36k extends.”
Rekt Capital is not as convinced. They noted the extreme dissimilarities between the BTC price movement before this halving and that in 2015 and 2019, when the price corrected before the halving.
In comments exclusive to BeInCrypto, Legal Analyst and Hedge Fund Manager James Koutoulas said that he is seeing echoes of the 2017 bull market.
This is due to a few reasons. Weak hands capitulated during the crypto winter, the piling losses of the Securities and Exchange Commission (SEC), and the imminent approval of the spot BTC ETF.
Read More: Best Upcoming Airdrops in 2023
BTC Price Prediction: Can Rally Reach $50,000?
The most likely EW count suggests that the BTC price is nearing the top of wave three in a five-wave upward movement (white). Wave three has extended, and the sub-wave is shown in black.
The most likely target for the top of wave three is at $47,600, 10% above the current price. Combining sub-waves one and three gives us our target for length for sub-wave five.
Afterward, the BTC price could begin the corrective wave four.
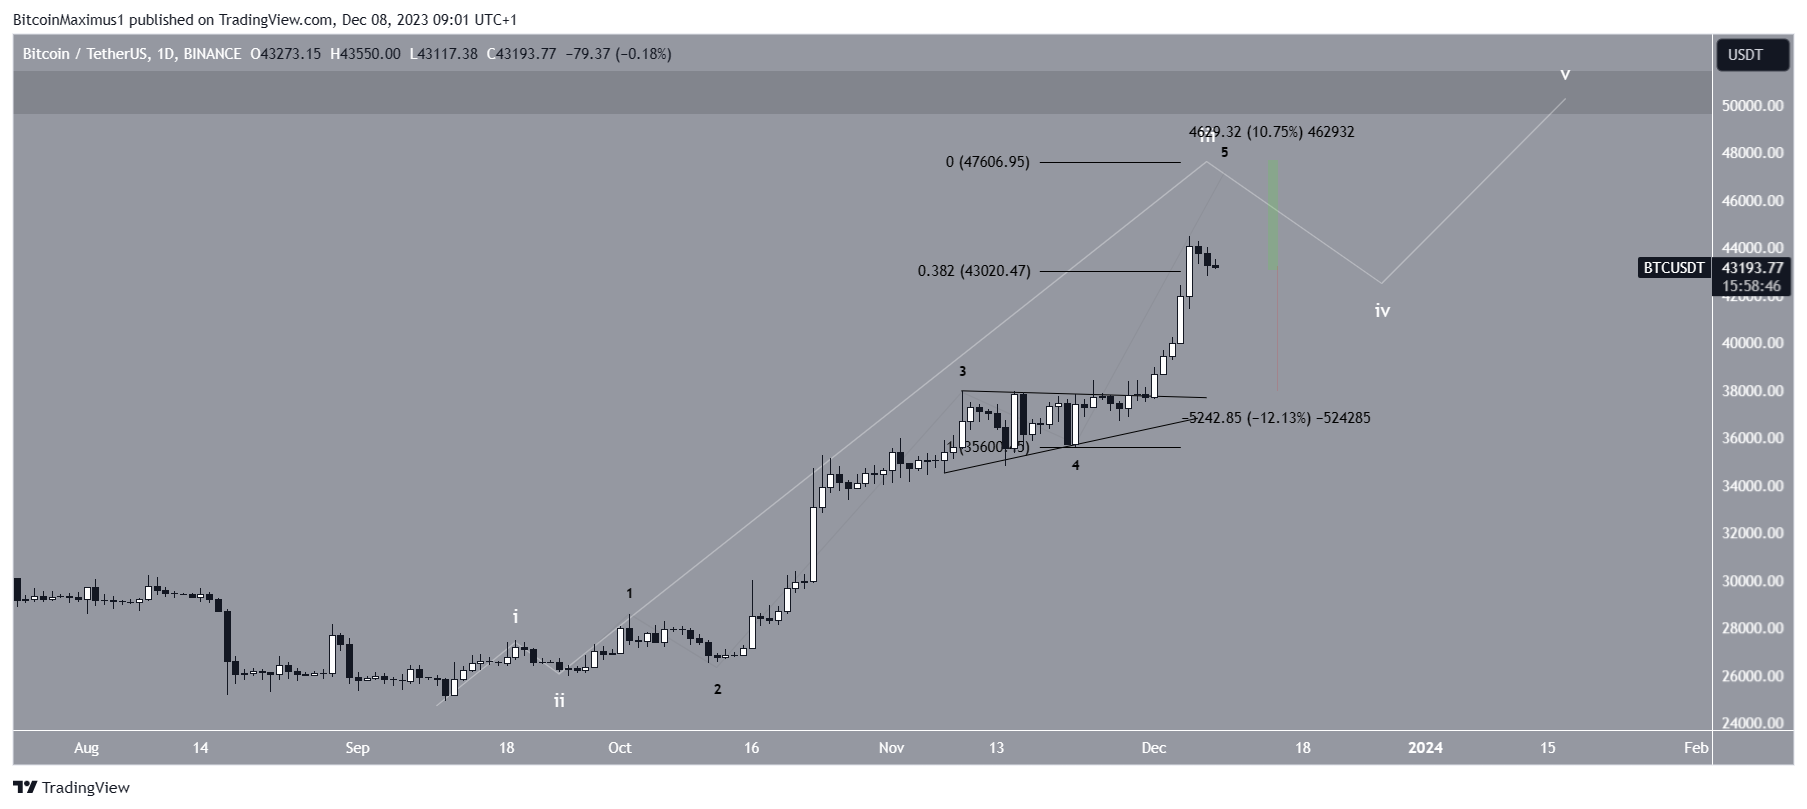
Despite this bullish BTC price prediction, a close below the $43,000 level could mean the correction has already begun. As a result, the BTC price could fall by 12%, reaching the $38,000 support.
For BeInCrypto’s latest crypto market analysis, click here.
Disclaimer
In line with the Trust Project guidelines, this price analysis article is for informational purposes only and should not be considered financial or investment advice. BeInCrypto is committed to accurate, unbiased reporting, but market conditions are subject to change without notice. Always conduct your own research and consult with a professional before making any financial decisions.