
Bitcoin (BTC) Price Reclaims Support

The Bitcoin (BTC) price reclaimed a support area after a brief decrease on November 16.
Currently, the price trades inside a neutral pattern above a critical horizontal support area. Will it break out?
Bitcoin Breaks Out from Long-Term Resistance
Bitcoin’s weekly chart shows that BTC has increased swiftly during the past five weeks. The Bitcoin price reclaimed the $31,000 horizontal area at the beginning of October.
This was a critical development since the area had intermittently acted as support and resistance since 2021. BTC reached a new yearly high of $37,978 in November.

Market traders use the Relative Strength Index (RSI) as a momentum indicator to identify overbought or oversold conditions and to decide whether to accumulate or sell an asset.
Read More: 9 Best Crypto Demo Accounts For Trading
Readings above 50 and an upward trend indicate that bulls still have an advantage, whereas readings below 50 suggest the opposite. The RSI is increasing and is above 50, both positive signs.
The Bitcoin Hashrate reached a new all-time high last week. The Hashrate is a measure of the computational power used by miners. An upward adjustment usually follows an increase in hash rate in BTC mining difficulty.
A report by CryptoQuant noted that even though such increases have usually been followed by downward movements, excitement about the Bitcoin ETF has taken over as the dominant narrative.
Additionally, Argentina elected a pro-Bitcoin candidate as its new president, and a recent report noted that Bitcoin adoption has reached a new yearly high, even though transaction fees are increasing.
Read More: 9 Best AI Crypto Trading Bots to Maximize Your Profits
BTC Price Prediction: Is $40,000 the Next Step?
Technical analysts employ the Elliott Wave (EW) theory to identify recurring long-term price patterns and investor psychology, which helps them determine the direction of a trend.
The most likely EW count suggests BTC began a five-wave increase (white) in September. In it, wave three has extended.
The sub-wave count is (in black), indicating that BTC is currently in wave four of this increase. Wave four has taken the shape of a triangle, the most likely pattern for the corrective wave.
Read More: Best Upcoming Airdrops in 2023
If the BTC upward movement continues, the price can increase by 35% and reach the next horizontal resistance at $50,000. This will be an increase of 35%, measuring from the current price.
Initially, a high near $42,800 can be expected before the price corrects and then completes the entire upward movement near $50,000.
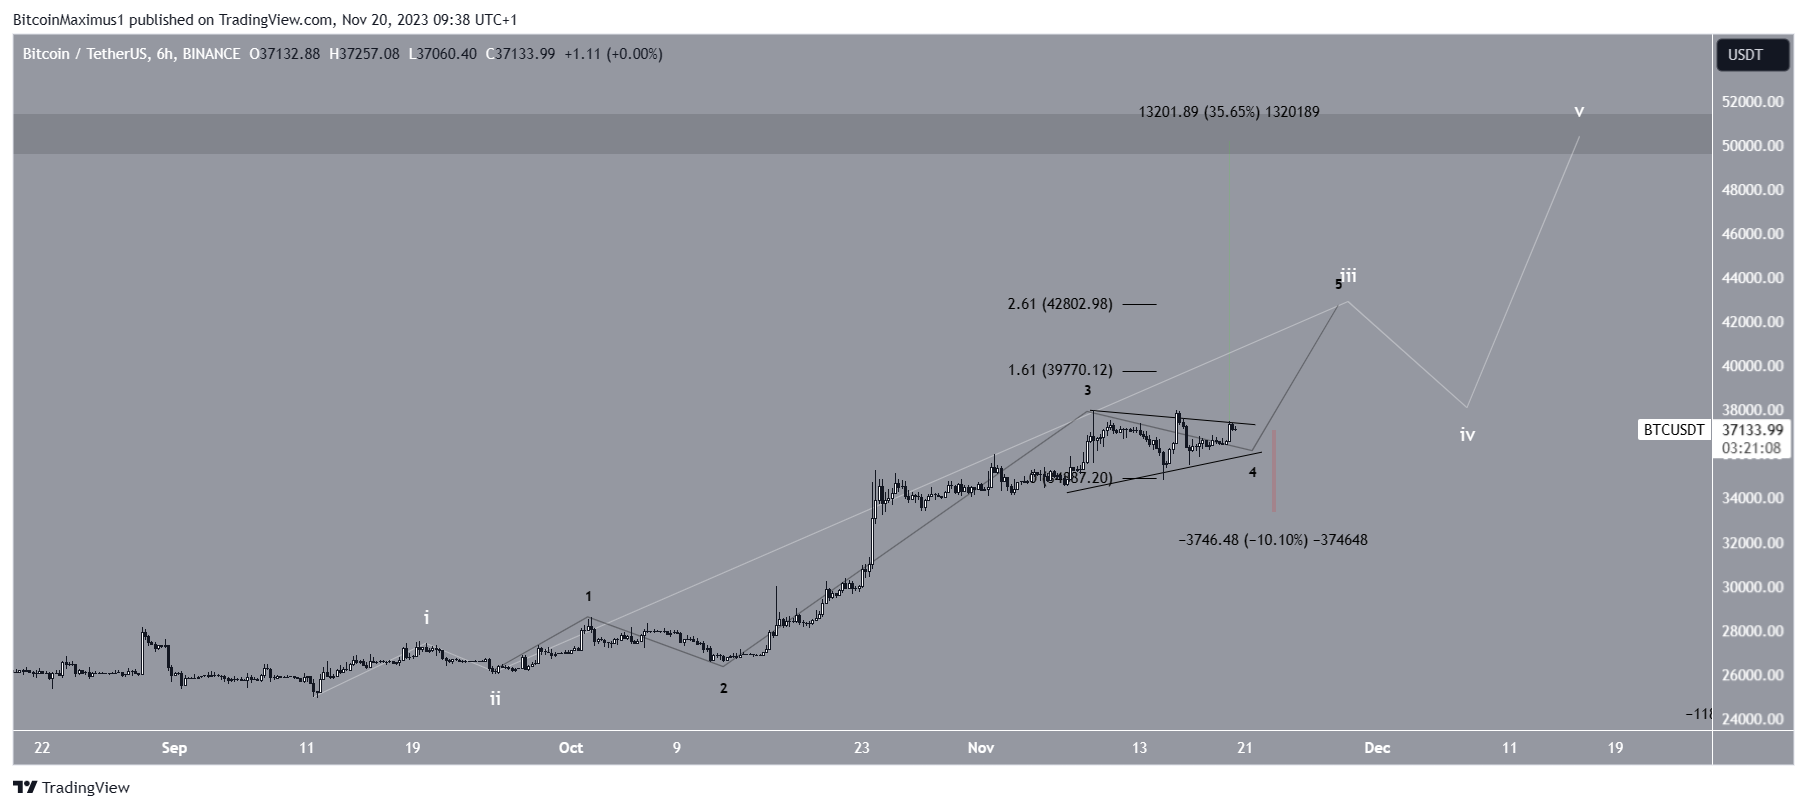
Despite this bullish BTC price prediction, a breakdown from the triangle can cause a 10% drop to the closest horizontal support area at $33,500.
For BeInCrypto’s latest crypto market analysis, click here.
Disclaimer
In line with the Trust Project guidelines, this price analysis article is for informational purposes only and should not be considered financial or investment advice. BeInCrypto is committed to accurate, unbiased reporting, but market conditions are subject to change without notice. Always conduct your own research and consult with a professional before making any financial decisions.