
BTC Falls Below $22,000; Is that all for Bulls?
The Bitcoin price prediction reveals that BTC continues to head to the downside as its price moves below $22,500 to touch the low of $20,464.
Bitcoin Prediction Statistics Data:
Bitcoin price now – $20,807
Bitcoin market cap – $397.7 billion
Bitcoin circulating supply – 19.0 million
Bitcoin total supply – 19.0 million
Bitcoin Coinmarketcap ranking – #1
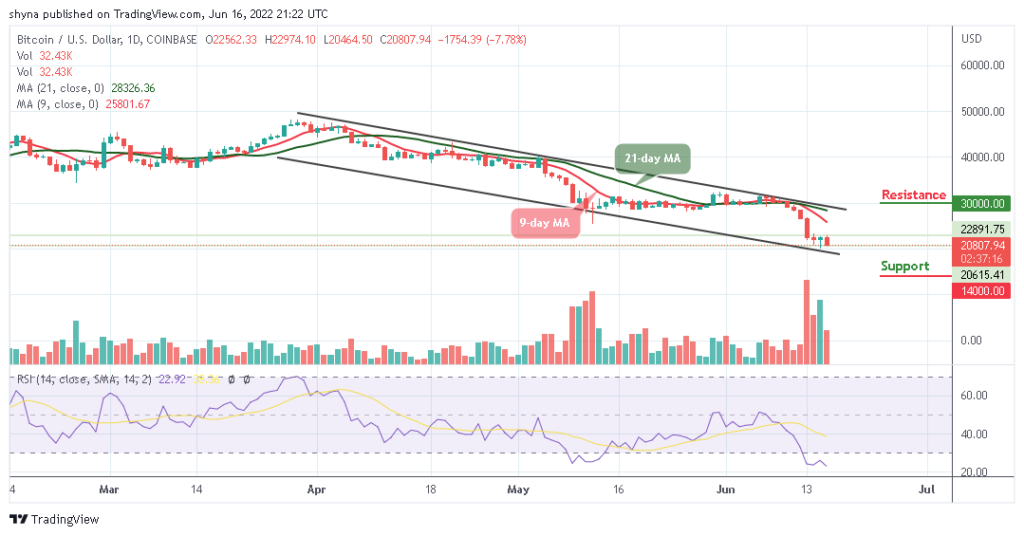
BTC/USD Long-term Trend: Bearish (Daily Chart)
Key levels:
Resistance Levels: $30,000, $32,000, $34,000

Support Levels: $14,000, $12,000, $10,000
BTC/USD is trading around $20,807 below the 9-day and 21-day moving averages. Looking at the daily chart, Bitcoin (BTC) has remained in a bearish zone, and it is likely to continue lower below the support of $20,000. However, the king coin is now plunging below the former resistance level of $22,000 which may cause many investors to take profits off the table.
Bitcoin Price Prediction: Would Bitcoin (BTC) Break More Downs?
The Bitcoin price is currently changing hands at $20,807, however, where BTC trends next may partly depend on whether or not buyers can close today’s candle above the $20,000 level. Should in case this comes to play, the bulls may propel prices higher, and then traders may expect the king coin to rise above the $25,000 resistance, which could later move towards the potential resistance levels at $30,000, $32,000, and $34,000.
On the other hand, if the Bitcoin price failed to close above the $22,000 resistance level; the price could drop below the lower boundary of the channel. A further low drive could send the price to $14,000, $12,000, and $10,000 supports. Meanwhile, the technical indicator Relative Strength Index (14) has recently revealed a sign of trend reversal as the signal line shows a possible bearish momentum within the clients.
BTC/USD Medium-Term Trend: Bearish (4H Chart)
Looking at the hourly chart, following the rejection of $21,012, BTC/USD is trading below the 9-day and 21-day moving averages. Looking at it from above, if the Bitcoin holds above $22,000, then the next level of resistance could be $23,000, along with the significant mentioned ascending trend-line. The next resistance could be $24,000 and above.
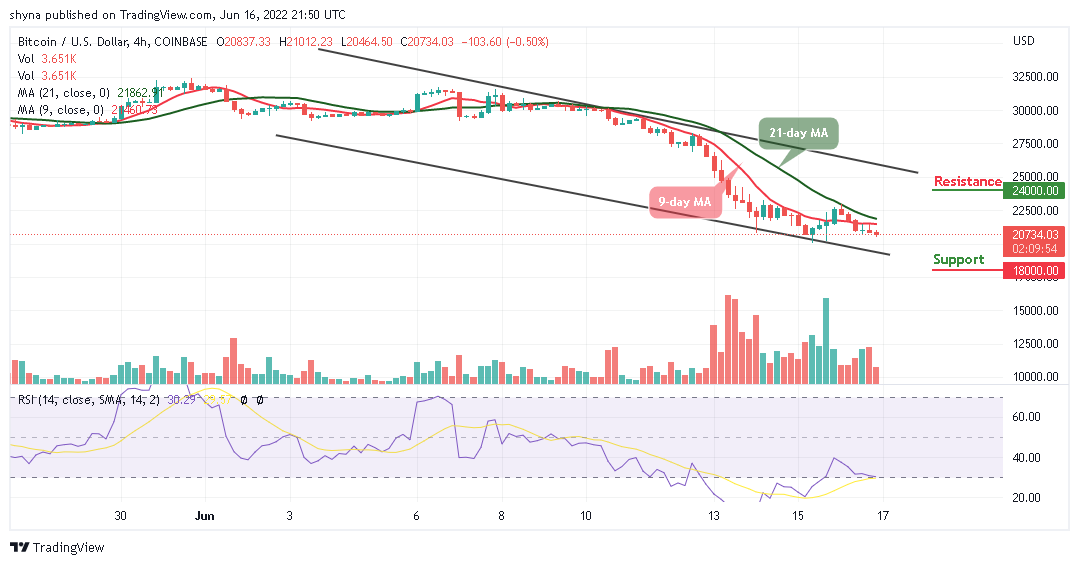
Meanwhile, as the technical indicator remains below, this might have signaled a temporary end to the bullish trend of Bitcoin for a moment. However, if the coin falls below the lower boundary of the channel, the market price may likely reach the support levels of $18,000 and below.
eToro – Our Recommended Bitcoin Platform
Regulated by the FCA, ASIC and CySEC
Buy Bitcoin with Bank transfer, Credit card, Neteller, Paypal, Skrill
Free Demo Account, Social Trading Community – 20 Million Users
Free Bitcoin Wallet – Unlosable Private Key
Copytrade Winning Bitcoin Traders – 83.7% Average Yearly Profit
68% of retail investor accounts lose money when trading CFDs with this provider.
Read more: