
Can Immutable (IMX) Price Increase Lead to All-Time High?

The Immutable (IMX) price has increased parabolically since September, reaching a new yearly high of $2.45 today.
The price currently trades inside a long-term resistance area. Will it be able to break out and reach a new all-time high, or has the rally this year come to an end?
Immutable Creates Ten Bullish Candlesticks
The IMX price has been mired in an uptrend since the start of the year. The upward movement led to a high of $1.60 in March.
After a descent under a descending resistance trend line, IMX created a higher low in October and broke out from the trend line the next month.
Since then, the IMX price has led to ten successive bullish weekly candlesticks. The altcoin trades inside the final long-term horizontal resistance area before the all-time high of $9.50. It reached a new yearly high of $2.46 today, the highest price since March 2022.
With the RSI as a momentum indicator, traders can determine whether a market is overbought or oversold and decide whether to accumulate or sell an asset.
Bulls have an advantage if the RSI reading is above 50 and the trend is upward, but if the reading is below 50, the opposite is true.
The weekly RSI is increasing and is above 50, both considered signs of a bullish trend.
Read More: What is Immutable?
IMX Price Prediction: How Long Will Increase Continue?
Similarly to the weekly time frame, the IMX price action in the daily time frame shows bullish signs. The rapid increase led to a breakout from an ascending parallel channel on December 11. Afterward, the IMX price validated the channel as support on December 18 (green icon).
However, the altcoin also trades inside a confluence of resistance levels at $2.35. Besides being a horizontal resistance area, the $2.35 resistance is also the 1.61 external Fib retracement level of the previous decrease.
Additionally, the daily RSI has generated a bearish divergence (green), something that often leads to significant downward movements.
So, whether the IMX price breaks out above the $2.35 area or gets rejected and falls back inside the channel’s confines will likely determine the future trend.
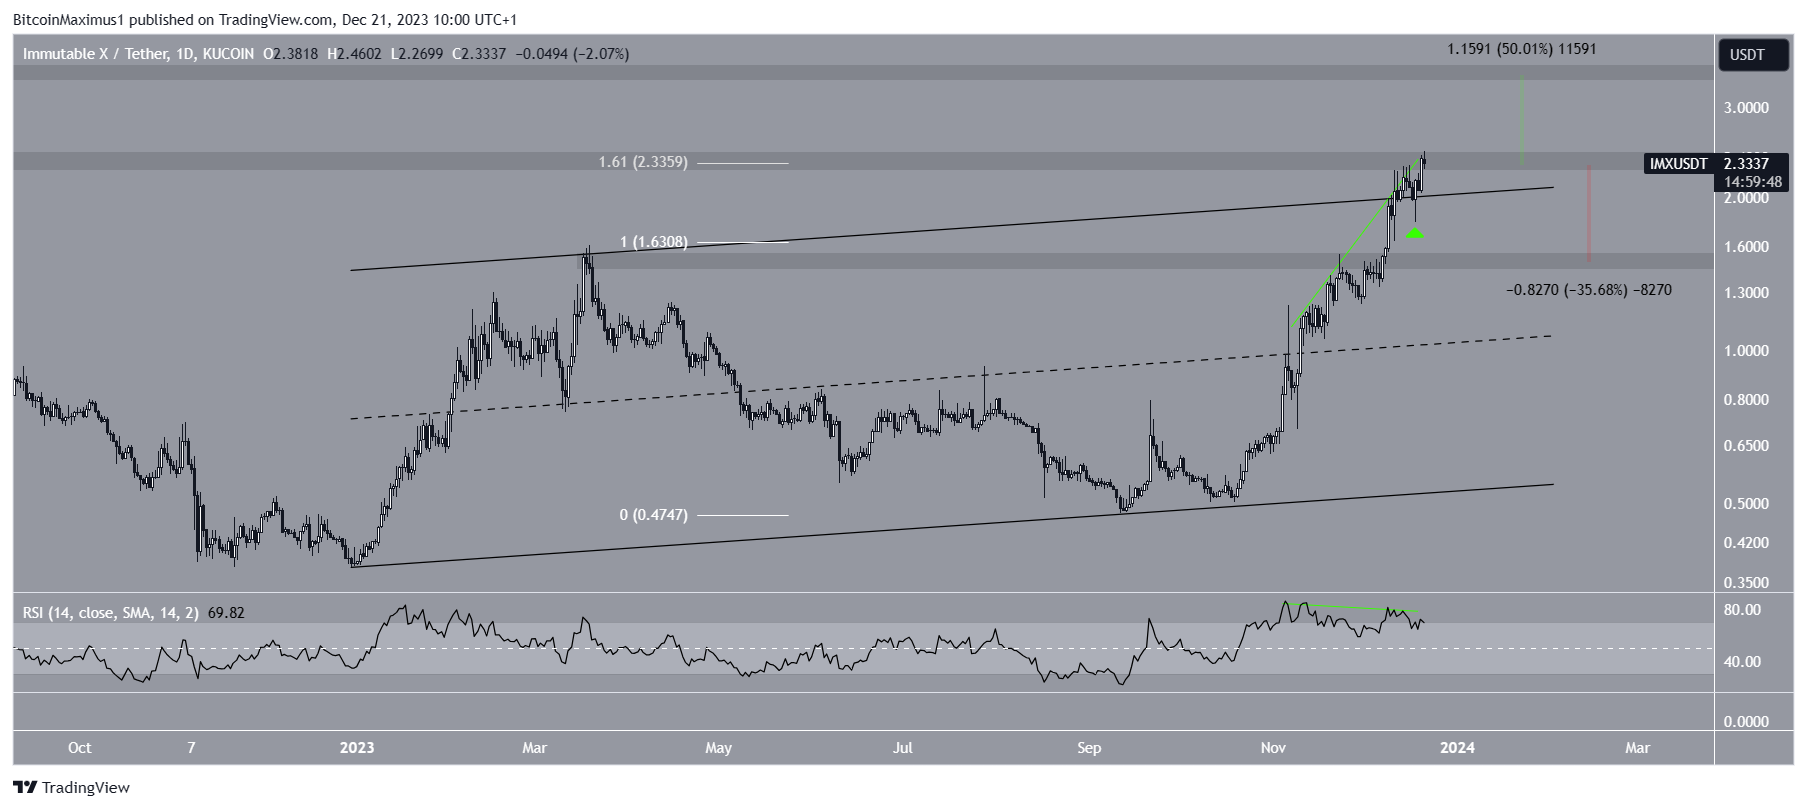
A successful breakout and daily close above $2.35 can trigger a 50% increase to the next resistance at $3.50. On the other hand, a fall below the channel can lead to a 35% drop to the closest support at $1.50.
For BeInCrypto‘s latest crypto market analysis, click here.
Disclaimer
In line with the Trust Project guidelines, this price analysis article is for informational purposes only and should not be considered financial or investment advice. BeInCrypto is committed to accurate, unbiased reporting, but market conditions are subject to change without notice. Always conduct your own research and consult with a professional before making any financial decisions. Please note that our Terms and Conditions, Privacy Policy, and Disclaimers have been updated.