
Is the NEO Price Increase Headed to $15 Next?

The NEO price has traded inside a corrective descending parallel channel for the past 86 days.
After breaking out from a short-term resistance, NEO unsuccessfully attempted to reclaim the channel’s midline.
NEO Returns to Support
The technical analysis of the daily time frame shows that NEO has traded below a long-term horizontal resistance area since February 2023.
The area caused several rejections, the most recent on January 1, 2024. The decrease culminated with a low of $9.80 on January 23. The NEO price bounced afterward and has increased since (green icon).

The daily Relative Strength Index (RSI) gives a mixed reading. Market traders use the RSI as a momentum indicator to identify overbought or oversold conditions and to decide whether to accumulate or sell an asset.
Readings above 50 and an upward trend indicate that bulls still have an advantage, whereas readings below 50 suggest the opposite. While the indicator is increasing, it is still below 50. Also, the bearish divergence trend line that started the decrease is still intact.
Read More: How To Make Money With Cryptocurrency: Top 4 Ways In 2024
NEO Price Prediction: Explaining Today’s Price Increase
The six-hour time frame shows that NEO has traded inside a descending parallel channel for the past 86 days. These channels usually contain corrective movements.
The NEO price bounced at the channel’s support trend line on January 23 (green icon). While it broke out from a short-term resistance trend line, it was rejected by the channel’s midline (red circle). The six-hour RSI legitimizes the short-term breakout since it increased above 50.
Before the breakout, GeniiAlert noted a significant surge in volume in the one-hour candlestick. Crypto Chart Monkey also believes the price will continue increasing. He tweeted:
Paradisers: Get ready for a potential bullish trade opportunity with #NEOUSDT. After facing resistance, NEO is now finding support at $10.08. We could see a turnaround here as it heads towards previous highs.
Furthermore, the wave count shows a completed W-X-Y correction. Technical analysts employ the Elliott Wave theory as a means to identify recurring long-term price patterns and investor psychology, which helps them determine the direction of a trend.
If the NEO price breaks out from the channel’s midline, it can increase by 30% to its resistance trend line at $14.80.
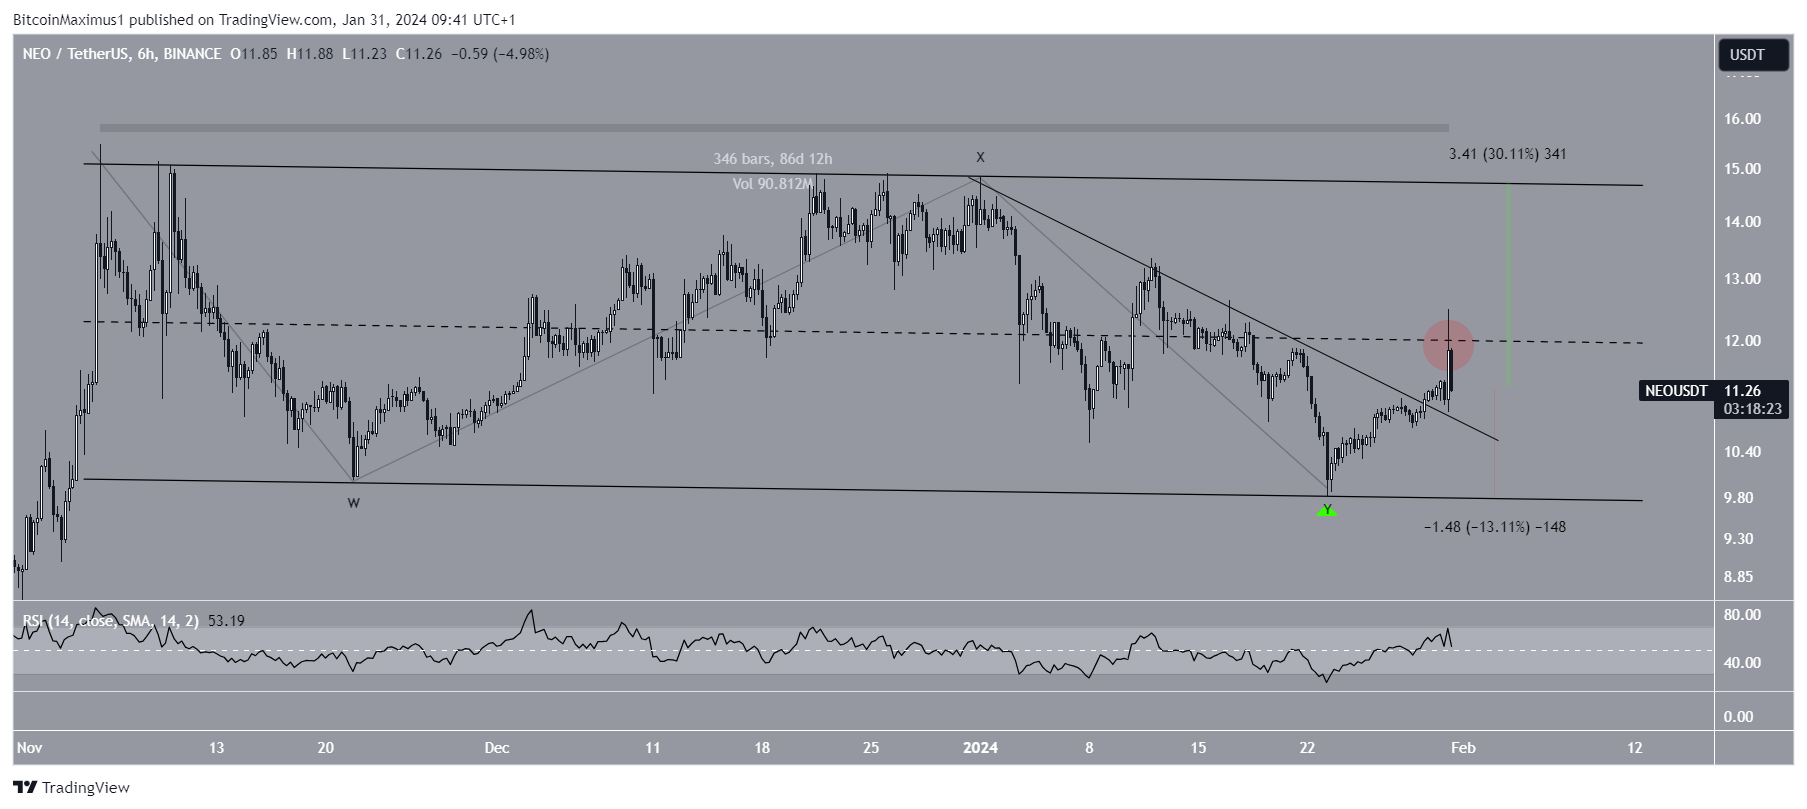
Despite this bullish NEO price prediction, a decrease below the short-term resistance can trigger a 13% drop to the channel’s support at $9.80.
Read More: Top 5 Initial Coin Offerings (ICOs) To Watch For in 2024
For BeInCrypto’s latest crypto market analysis, click here.
Disclaimer
In line with the Trust Project guidelines, this price analysis article is for informational purposes only and should not be considered financial or investment advice. BeInCrypto is committed to accurate, unbiased reporting, but market conditions are subject to change without notice. Always conduct your own research and consult with a professional before making any financial decisions. Please note that our Terms and Conditions, Privacy Policy, and Disclaimers have been updated.