
Shiba Inu (SHIB) Price Halts With Surge in Exchange Deposits

In this analysis, we delve into Shiba Inu’s (SHIB) recent price action, examining key technical indicators and market signals across daily and four-hour timeframes.
Our focus includes the role of the Ichimoku cloud, the significance of the Tenkan-sen plateaus, and recent trends in exchange depositing addresses to provide a comprehensive outlook for SHIB.
Daily and Four-Hour Timeframe Analysis
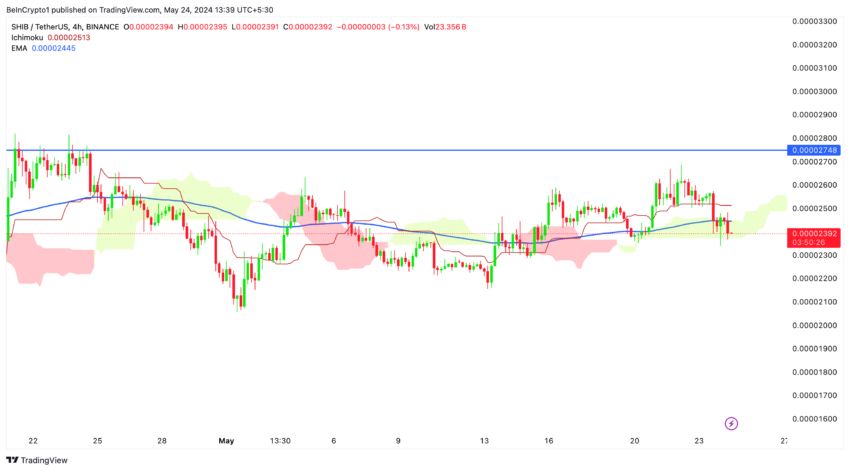
Let’s delve into Shiba Inu (SHIB) ‘s price action on the daily and four-hour timeframes. Currently, SHIB is trading at $0.00002393. Notably, the price has failed to enter the daily Ichimoku cloud on the upside, which is a major support level.
The price is now approaching a mid-term support level, represented by the red Tenkan-sen plateau on the chart. The 100 EMA (Exponential Moving Average) on the daily timeframe serves as a crucial mid-term support level for SHIB’s price.

The Tenkan-sen, or conversion line, is a key part of the Ichimoku system in technical analysis. It shows the average of the highest and lowest prices over the past nine periods, giving a short-term view of price trends.
Importance of Tenkan-Sen Plateaus
Plateau Formation: When the Tenkan-sen flattens, it indicates a balance between buyers and sellers, creating important market levels.
Support: If the price is above a Tenkan-sen plateau and falls, the plateau can act as a support level, where buyers are likely to step in.
Resistance: If the price is below a Tenkan-sen plateau and rises, the plateau can act as a resistance level, where sellers are likely to step in.
Read More: How To Buy Shiba Inu (SHIB) and Everything You Need To Know
Zooming into the four-hour timeframe, we see a similar pattern. The price attempts to break below the Ichimoku cloud, which could accelerate the downward movement. If it tests this level, the lower boundary of the cloud will act as a critical support level to watch.
Additionally, the price has broken below the 100 EMA in the four-hour timeframe, which is also a bearish signal.
These combined signals highlight the importance of this zone as a resistance area. A break above this zone could trigger a substantial upward movement of 10% to 20%. Conversely, if the price remains below the 4H 100EMA, it could indicate a bearish continuation, potentially driving the price down to $0.00002000.
SHIB/BTC Chart Analysis
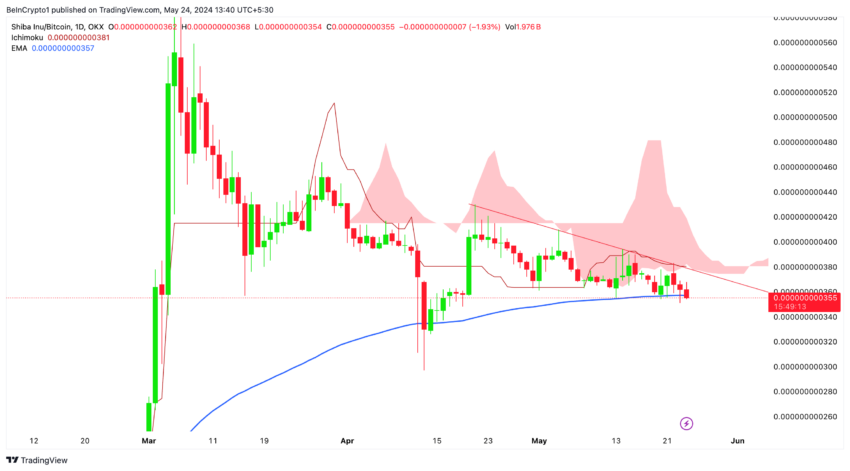
The SHIB/BTC chart also exhibits bearish signals for Shiba Inu.
SHIB/BTC has tested the lower boundary on the daily timeframe and is now attempting to break below the 100 EMA, signaling a highly bearish outlook for SHIB.
If SHIB enters the cloud to the upside and Bitcoin’s price appreciates to $70,000, SHIB could potentially break above the $0.0000265 price range. However, if these conditions are not met, the bearish outlook for SHIB may persist.
Recent Spike in Exchange Depositing Addresses: Bearish Implications
The chart shows a significant spike in the number of exchange depositing addresses at the end of May. This sudden increase suggests that many SHIB holders transfer their tokens to exchanges.
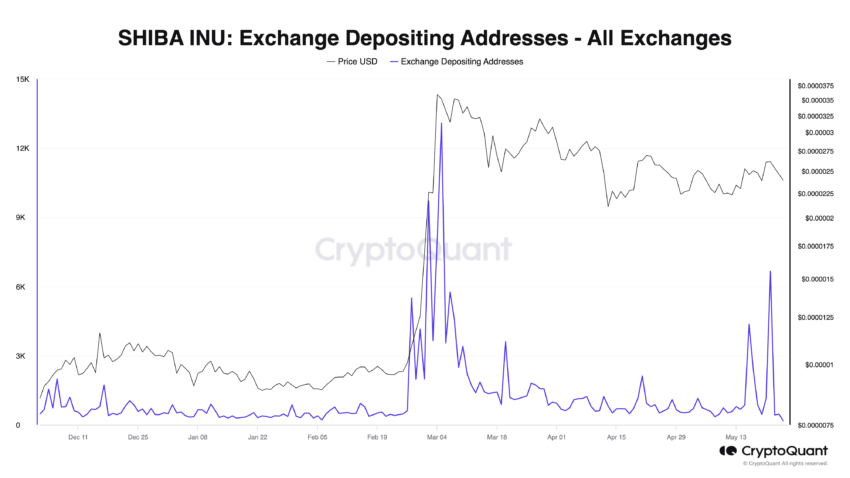
Potential Selling Pressure: Historically, increasing depositing addresses often precedes a sell-off. When holders move their tokens to exchanges, they typically liquidate their positions, creating selling pressure in the market.
Read More: Shiba Inu (SHIB) Price Prediction 2024/2025/2030
Bearish Implications: The recent spike indicates that more SHIB holders might be preparing to sell their assets. This influx of sell orders can increase supply on exchanges, potentially driving the price down if the demand does not match the supply.
Strategic Recommendations
Outlook: Bearish to Neutral
The current price action suggests a bearish trend, especially with the price attempting to break below the Ichimoku cloud in the four-hour timeframe.
The recent break below the 4H 100 EMA on the four-hour chart reinforces the bearish outlook. Monitor for further declines if the price fails to hold above key support levels, particularly the lower boundary of the 4H Ichimoku cloud.
The bearish outlook could be invalidated if SHIB manages to reenter the daily Ichimoku cloud. A key level to watch is the upper boundary of the daily Ichimoku cloud at $0.000265. A break above this level could shift the outlook to neutral or even bullish.
Disclaimer
In line with the Trust Project guidelines, this price analysis article is for informational purposes only and should not be considered financial or investment advice. BeInCrypto is committed to accurate, unbiased reporting, but market conditions are subject to change without notice. Always conduct your own research and consult with a professional before making any financial decisions. Please note that our Terms and Conditions, Privacy Policy, and Disclaimers have been updated.