
Solana (SOL) Price Prediction: New Highs in February?

The Solana (SOL) price has gradually increased since January 23 and is approaching its 2023 highs.
While SOL broke out from a short-term resistance level, it still trades below a long-term one.
Solana Creates Double Top
The weekly time frame technical analysis shows that SOL reached a 2023 high of $126 in December but has fallen since.The decrease culminated with a low of $79 in January 2024.
The SOL price has increased since, creating successive bullish weekly candlesticks. It reached a high of $119 on February 14, 2024.

While the high was made above a long-term Fib retracement resistance level, SOL has potentially created a double top relative to its 2023 high.
The weekly Relative Strength Index (RSI) also gives a bearish reading. Market traders use the RSI as a momentum indicator to identify overbought or oversold conditions and to decide whether to accumulate or sell an asset.
Readings above 50 and an upward trend indicate that bulls still have an advantage, whereas readings below 50 suggest the opposite.
While the indicator is increasing and above 50, it has also generated a bearish divergence (green trend line), often preceding downward movements.
Read More: Solana (SOL) Price Prediction 2024/2025/2030
What Are Analysts Saying?
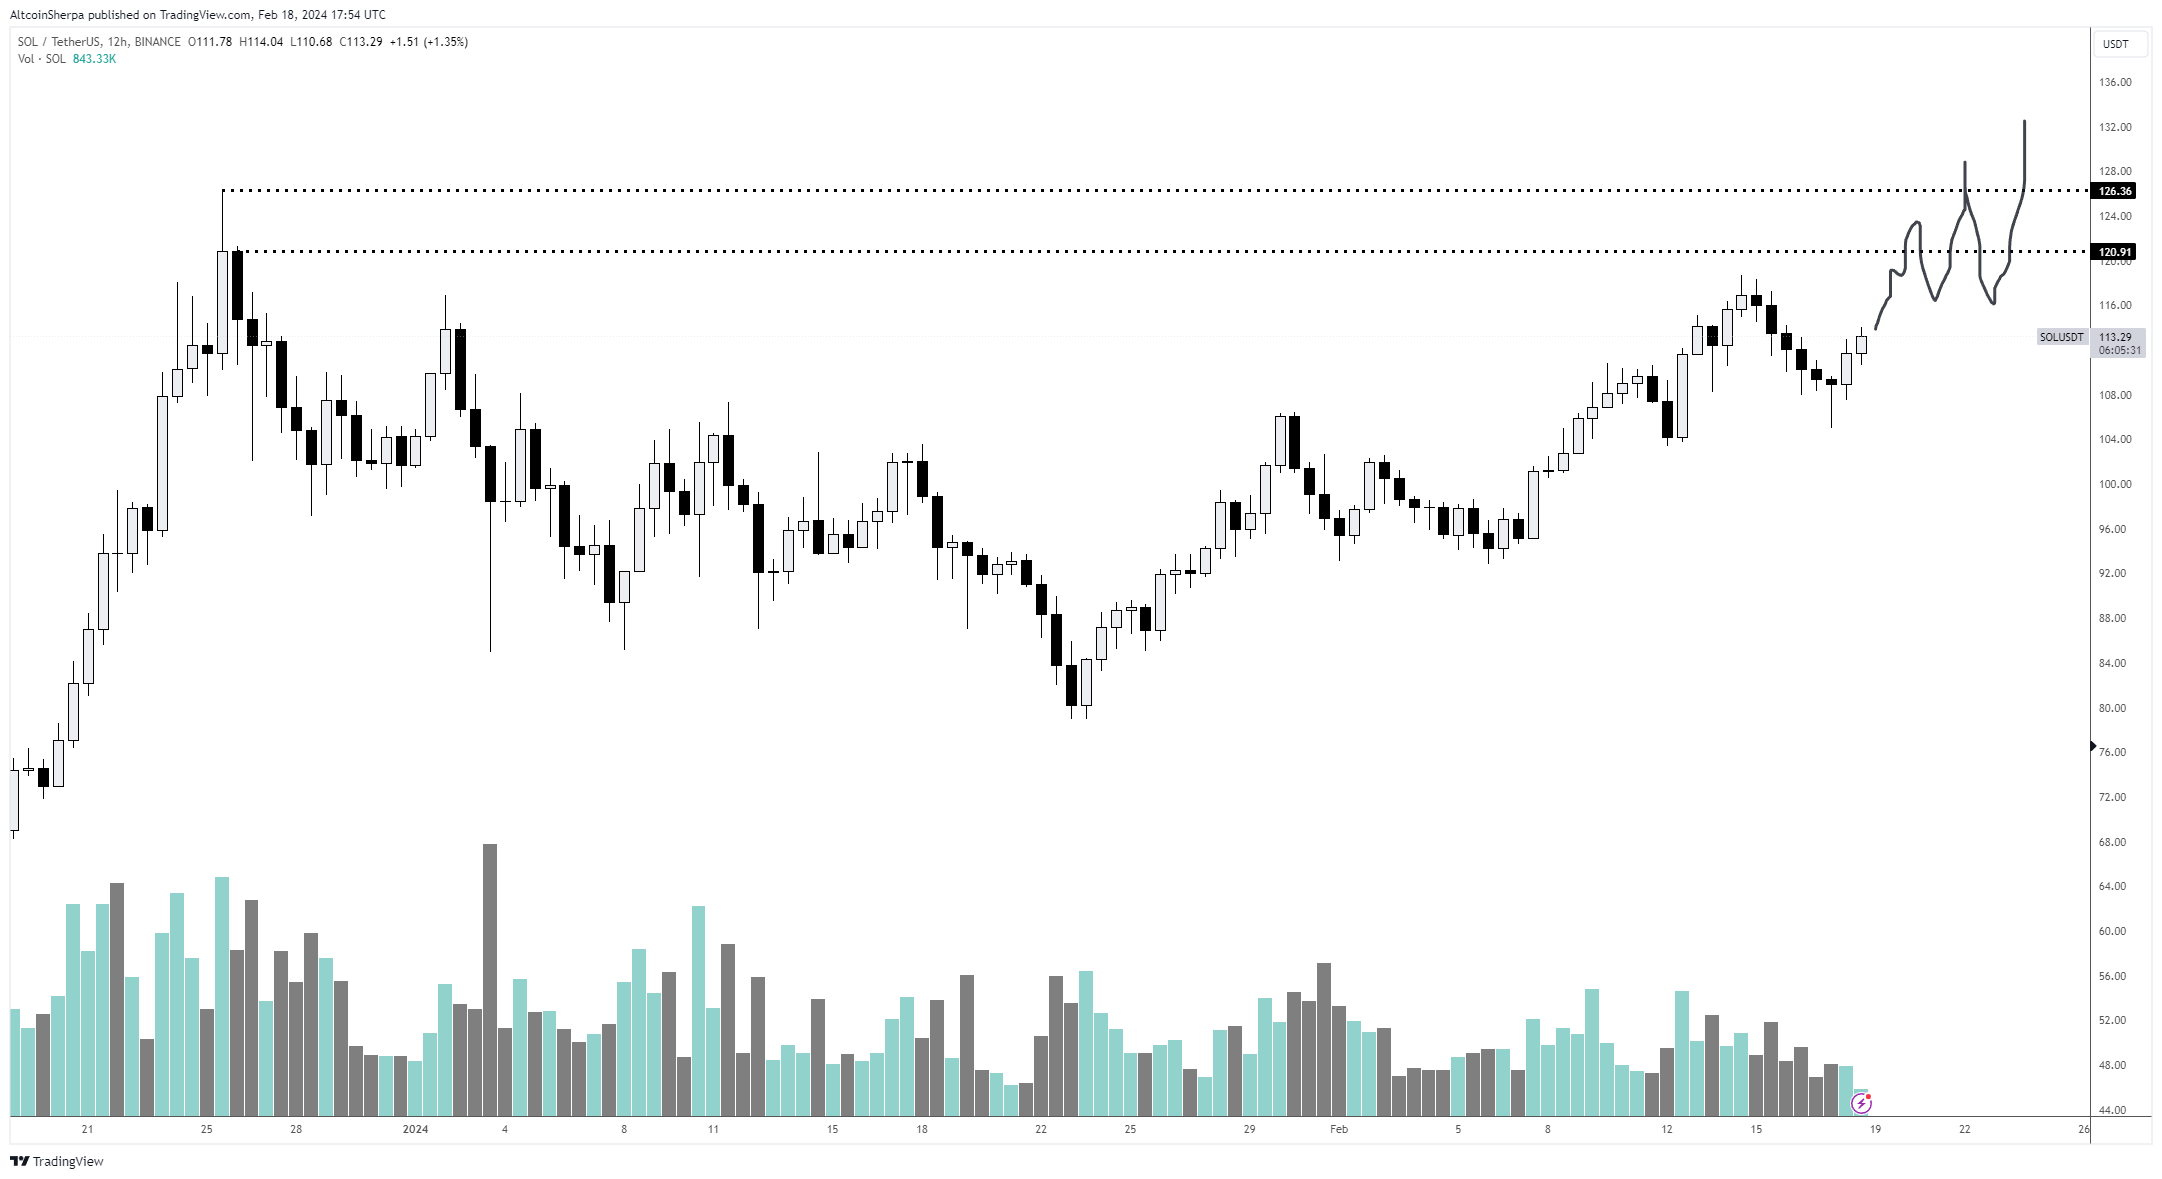
Cryptocurrency traders and analysts on X positively view the future SOL trend. Cryptocurrency trader Altcoin Sherpa is bullish on SOL.
“$SOL: It’s a bizarre chart seeing this grind up slowly. I expect some sort of selling to happen around the highs given the length of time spent in between each peak but the entire market is still up only right now. I think that expecting any huge correction for #Solana is meh for now. Bullish on this one bigly going into 2024 and I think most would make more $ just buying here and sitting on this thing for months instead of trying to wait for the 20% correction.” He stated.
InmortalCrypto noted that SOL has surpassed BNB in the market cap rankings. However, SOL has fallen below BNB since the tweet. Sam Mti is excited that SOL is approaching $120.
Read More: How to Buy Solana (SOL)
SOL Price Prediction: Will There Be New Highs in February?
While the weekly time frame is undetermined, the daily chart provides a more bullish outlook. This is because of the price action, wave count, and RSI readings.
The SOL price action shows the price moved and closed above the $105 resistance area. This aligns with an RSI increase above 50 (green icon).
Additionally, the wave count suggests SOL is in the fifth and final wave of its upward movement that started in June. Technical analysts employ the Elliott Wave theory to identify recurring long-term price patterns and investor psychology, which helps them determine the direction of a trend.
If the count is correct, SOL will reach a high near the next long-term resistance at $145, 30% above the current price.
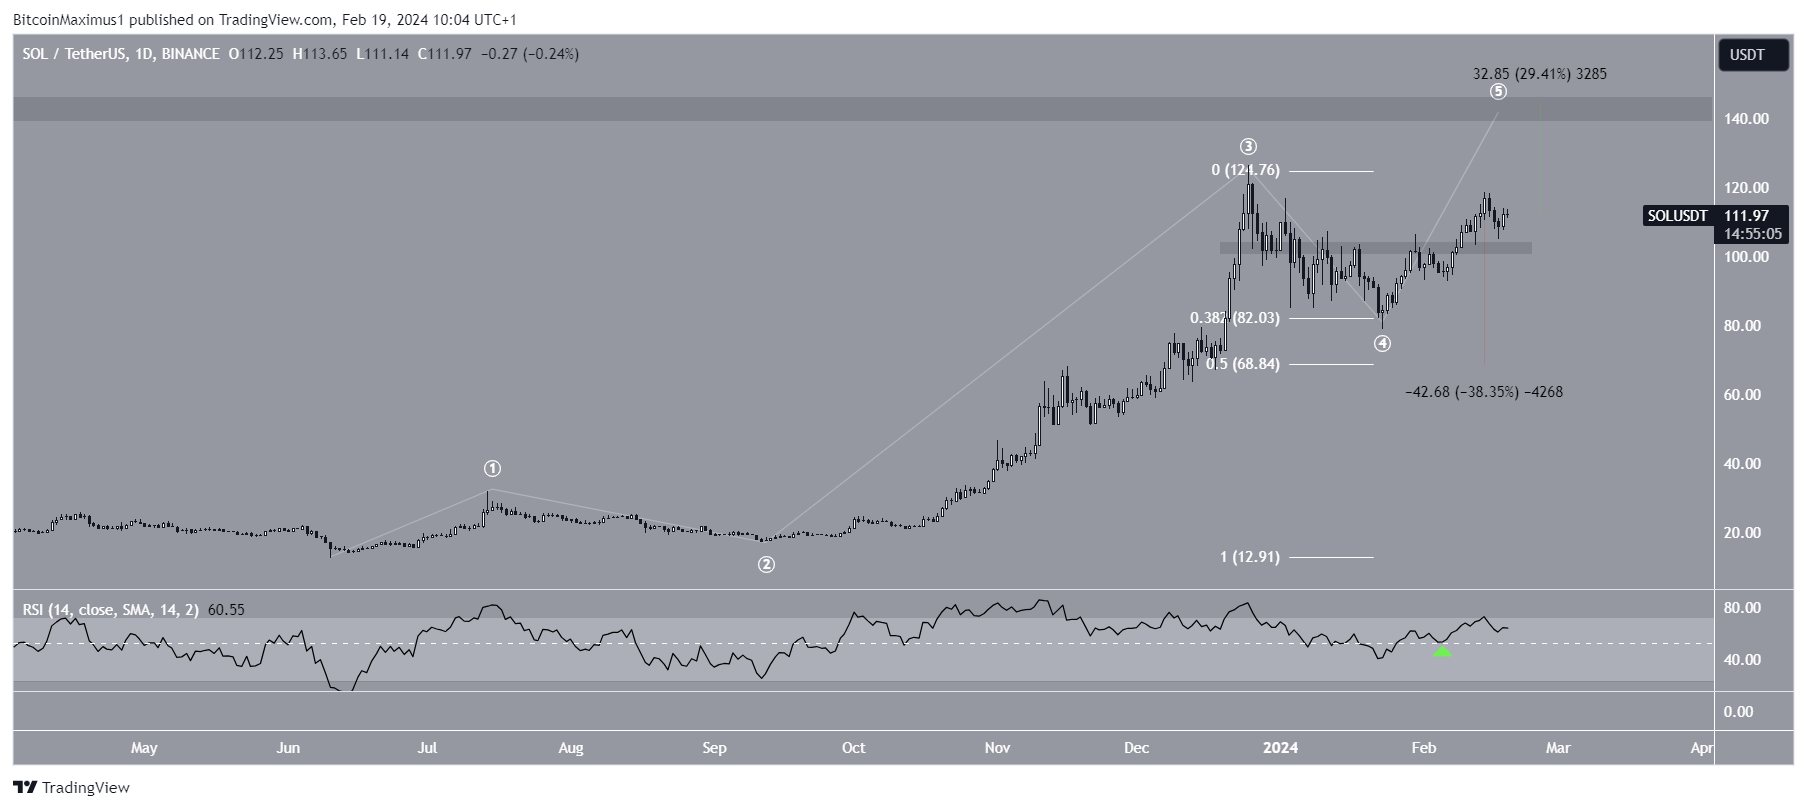
Despite the bullish SOL price prediction, closing below $105 will mean the price is still correcting. Then, SOL could fall 40% to the next closest support at $69, created by the 0.5 Fib retracement support level.
For BeInCrypto‘s latest crypto market analysis, click here.
Disclaimer
In line with the Trust Project guidelines, this price analysis article is for informational purposes only and should not be considered financial or investment advice. BeInCrypto is committed to accurate, unbiased reporting, but market conditions are subject to change without notice. Always conduct your own research and consult with a professional before making any financial decisions. Please note that our Terms and Conditions, Privacy Policy, and Disclaimers have been updated.