UNI Price Prediction: What Lies Above $10?
The Uniswap (UNI) price reached a two-year high of $12.85 on February 24 but has fallen slightly since.
UNI broke out from long-term horizontal and diagonal resistance levels during the upward movement.
UNI Breaks Out Above Resistance
The weekly time frame technical analysis shows that UNI has increased since October 2023, when it bounced at a long-term horizontal support area. The upward movement caused a breakout from a descending resistance trend line the next month. At the time, the trend line had existed for 480 days.
After several retests, the UNI price began another upward movement at the start of 2024 and broke out from a horizontal resistance area. The increase culminated with a high of $12.86 last week. UNI fell slightly afterward.
The weekly Relative Strength Index (RSI) supports the increase. Market traders use the RSI as a momentum indicator to identify overbought or oversold conditions and to decide whether to accumulate or sell an asset. Readings above 50 and an upward trend indicate that bulls still have an advantage, whereas readings below 50 suggest the opposite.
Firstly, the upward movement was preceded by a bullish divergence in the RSI (green trend line). The RSI has trended upward since and just moved above 70. There is no bearish divergence to negate the preceding upward movement.
Read More: Uniswap (UNI) Price Prediction 2023/2025/2030
UNI Price Prediction: Where Will the Breakout Lead?
The technical analysis of the daily time frame aligns with the weekly one, providing a bullish reading. This is because of the wave count and RSI readings.
The most likely wave count predicts the UNI upward movement will continue. Technical analysts utilize the Elliott Wave theory to ascertain the trend’s direction by studying recurring long-term price patterns and investor psychology.
The wave count predicts that UNI is in wave three of a five-wave upward movement (white). The sub-wave count is given in black, suggesting that UNI is in sub-wave four.
Read More: How to Buy Uniswap
If the count is correct, the UNI price will begin another upward movement after the current correction is complete. This can take the UNI price to the next resistance at $16.10, giving waves one and three a 1:1.61 ratio. This would be an upward move of 50%.
The daily RSI supports this possibility since the indicator is increasing and is above 70.
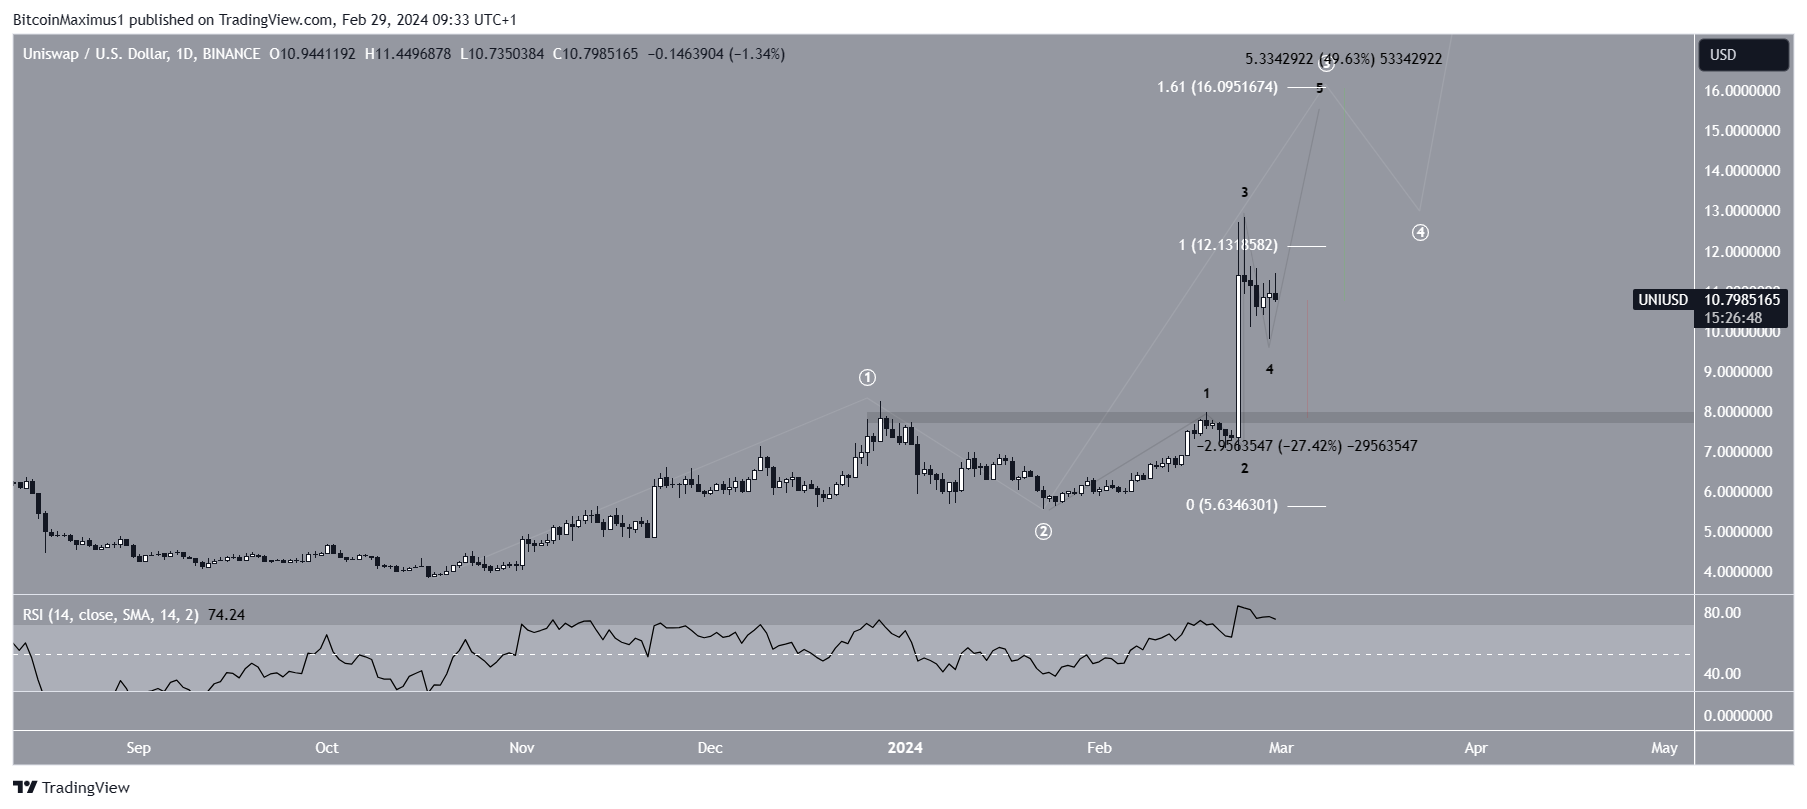
Despite the bullish UNI price prediction, failure to break out from the $12.10 highs can trigger a nearly 30% drop to the closest support at $7.80.
Read More: 12 Best Decentralized Exchanges for 2023
For BeInCrypto‘s latest crypto market analysis, click here.
Disclaimer
All the information contained on our website is published in good faith and for general information purposes only. Any action the reader takes upon the information found on our website is strictly at their own risk.